| __timestamp | American Airlines Group Inc. | Parker-Hannifin Corporation |
|---|---|---|
| Wednesday, January 1, 2014 | 31939000000 | 10188227000 |
| Thursday, January 1, 2015 | 27967000000 | 9655245000 |
| Friday, January 1, 2016 | 28339000000 | 8823384000 |
| Sunday, January 1, 2017 | 31154000000 | 9188962000 |
| Monday, January 1, 2018 | 34490000000 | 10762841000 |
| Tuesday, January 1, 2019 | 35379000000 | 10703484000 |
| Wednesday, January 1, 2020 | 24933000000 | 10286518000 |
| Friday, January 1, 2021 | 29855000000 | 10449680000 |
| Saturday, January 1, 2022 | 39934000000 | 11387267000 |
| Sunday, January 1, 2023 | 40978000000 | 12635892000 |
| Monday, January 1, 2024 | 12801816000 |
Data in motion
In the ever-evolving landscape of American industry, Parker-Hannifin Corporation and American Airlines Group Inc. stand as titans in their respective fields. From 2014 to 2023, these companies have showcased distinct trajectories in their cost of revenue. American Airlines, a leader in the aviation sector, saw its cost of revenue fluctuate, peaking in 2023 with a 28% increase from its 2014 figures. Meanwhile, Parker-Hannifin, a stalwart in motion and control technologies, demonstrated a steady upward trend, culminating in a 24% rise over the same period. This divergence highlights the contrasting challenges and opportunities faced by the aviation and manufacturing sectors. Notably, 2020 marked a dip for American Airlines, reflecting the global pandemic's impact, while Parker-Hannifin's resilience shone through. As we look to 2024, Parker-Hannifin's data remains robust, while American Airlines' figures are yet to be revealed, leaving room for speculation and anticipation.
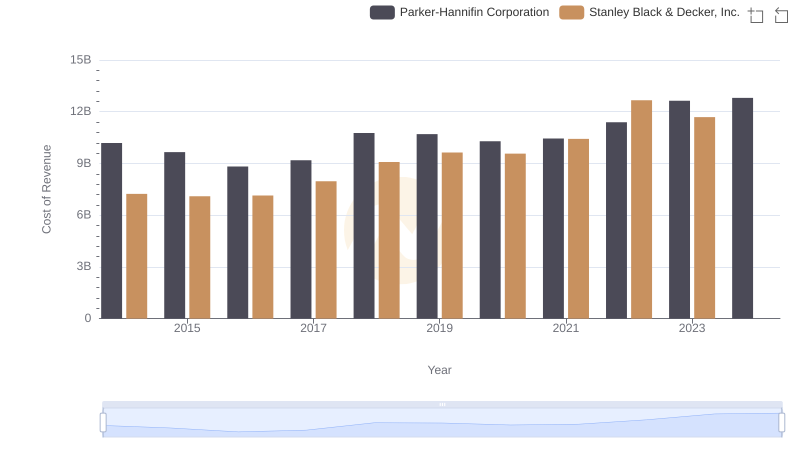
Analyzing Cost of Revenue: Parker-Hannifin Corporation and Stanley Black & Decker, Inc.
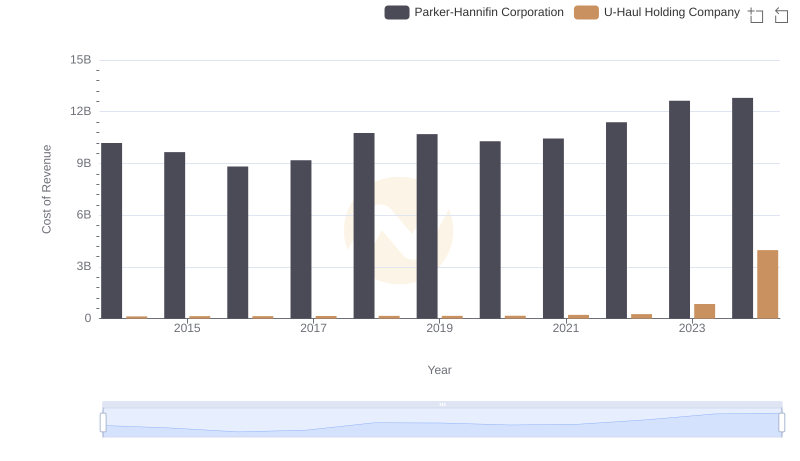
Cost Insights: Breaking Down Parker-Hannifin Corporation and U-Haul Holding Company's Expenses
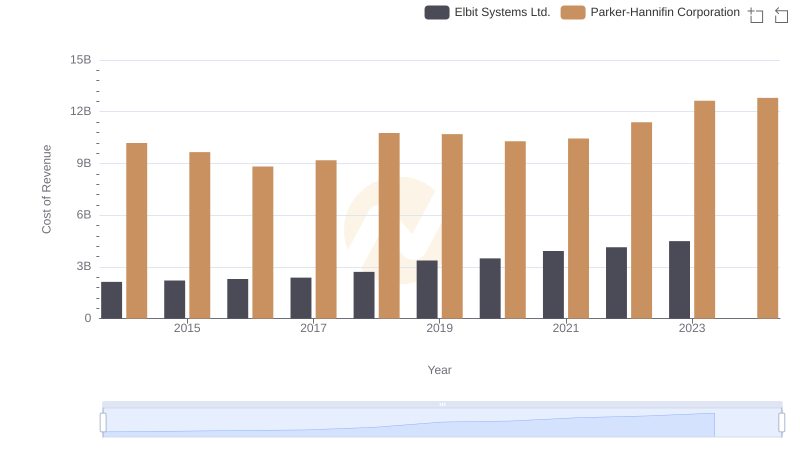
Cost of Revenue Trends: Parker-Hannifin Corporation vs Elbit Systems Ltd.
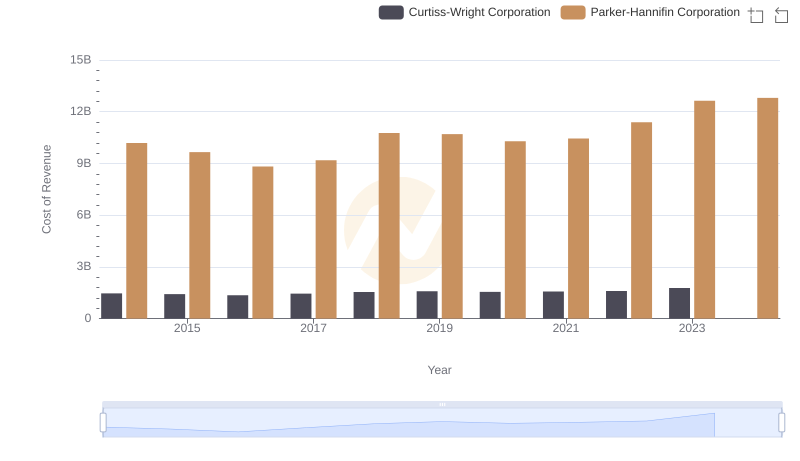
Analyzing Cost of Revenue: Parker-Hannifin Corporation and Curtiss-Wright Corporation
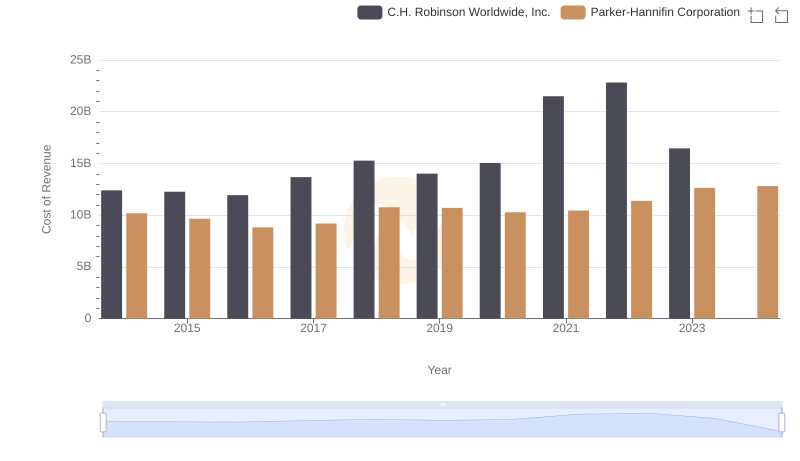
Cost of Revenue Trends: Parker-Hannifin Corporation vs C.H. Robinson Worldwide, Inc.
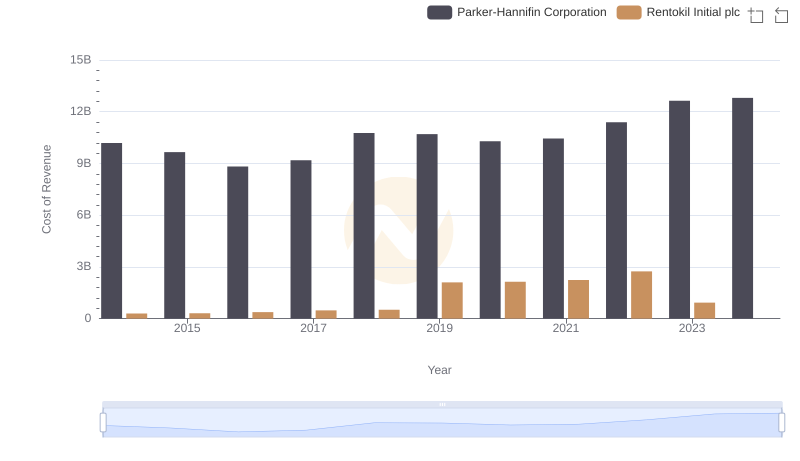
Analyzing Cost of Revenue: Parker-Hannifin Corporation and Rentokil Initial plc
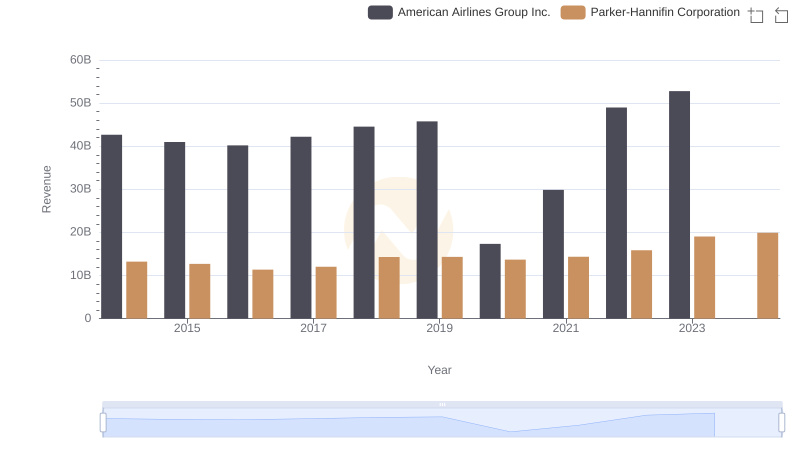
Revenue Insights: Parker-Hannifin Corporation and American Airlines Group Inc. Performance Compared
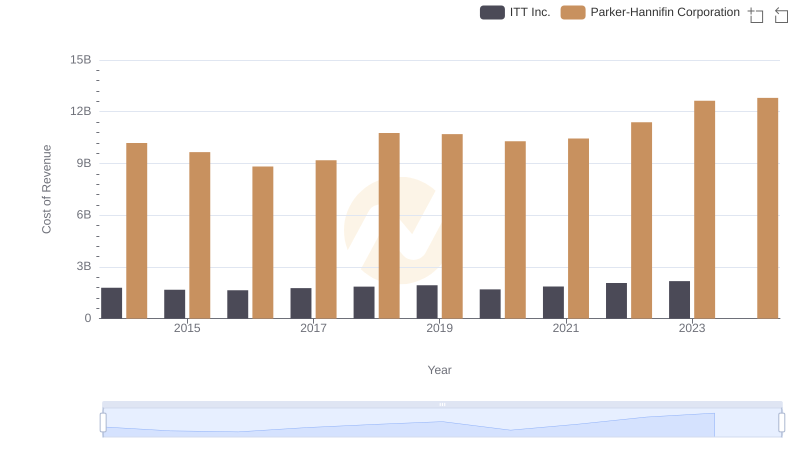
Cost of Revenue Trends: Parker-Hannifin Corporation vs ITT Inc.
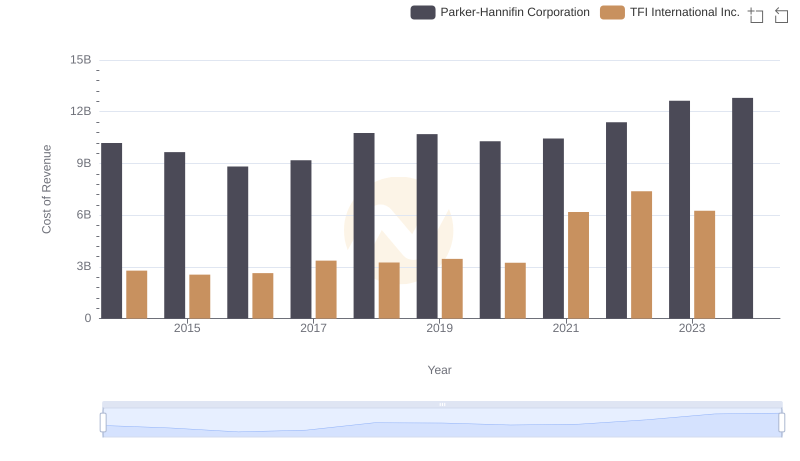
Cost of Revenue: Key Insights for Parker-Hannifin Corporation and TFI International Inc.
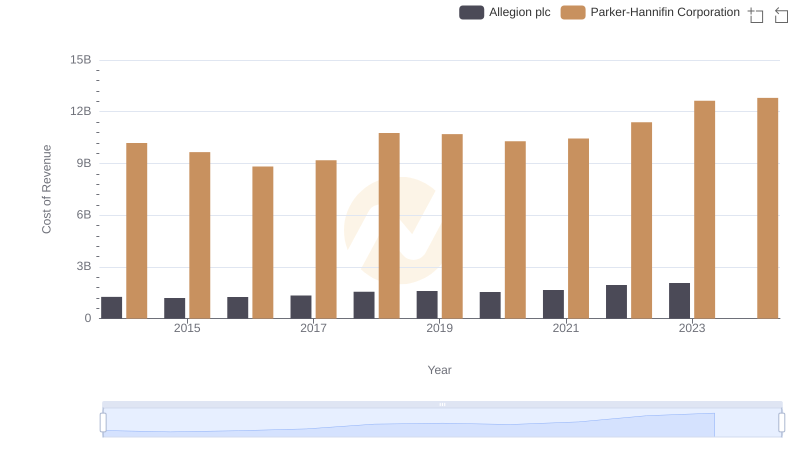
Cost of Revenue Comparison: Parker-Hannifin Corporation vs Allegion plc

Selling, General, and Administrative Costs: Parker-Hannifin Corporation vs American Airlines Group Inc.