| __timestamp | Parker-Hannifin Corporation | Saia, Inc. |
|---|---|---|
| Wednesday, January 1, 2014 | 1633992000 | 37563000 |
| Thursday, January 1, 2015 | 1544746000 | 26832000 |
| Friday, January 1, 2016 | 1359360000 | 39625000 |
| Sunday, January 1, 2017 | 1453935000 | 37162000 |
| Monday, January 1, 2018 | 1657152000 | 38425000 |
| Tuesday, January 1, 2019 | 1543939000 | 43073000 |
| Wednesday, January 1, 2020 | 1656553000 | 49761000 |
| Friday, January 1, 2021 | 1527302000 | 61345000 |
| Saturday, January 1, 2022 | 1627116000 | 56601000 |
| Sunday, January 1, 2023 | 3354103000 | 67984000 |
| Monday, January 1, 2024 | 3315177000 |
Infusing magic into the data realm
In the world of industrial and logistics giants, Parker-Hannifin Corporation and Saia, Inc. present a fascinating study in contrasts. Over the past decade, Parker-Hannifin has consistently outpaced Saia in Selling, General, and Administrative (SG&A) expenses, with a staggering 2023 figure that is nearly 50 times that of Saia. This trend highlights Parker-Hannifin's expansive operational scale and strategic investments.
From 2014 to 2023, Parker-Hannifin's SG&A expenses have shown a robust upward trajectory, peaking in 2023 with a 105% increase from 2014. In contrast, Saia's expenses, while growing, reflect a more modest 81% rise over the same period. The data for 2024 remains incomplete, offering a tantalizing glimpse into future trends.
This comparison underscores the diverse strategies and market positions of these two industry leaders, providing valuable insights for investors and analysts alike.
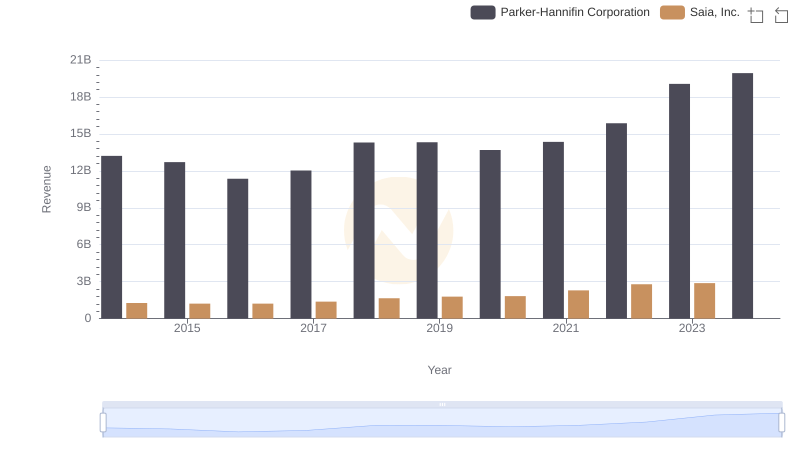
Breaking Down Revenue Trends: Parker-Hannifin Corporation vs Saia, Inc.
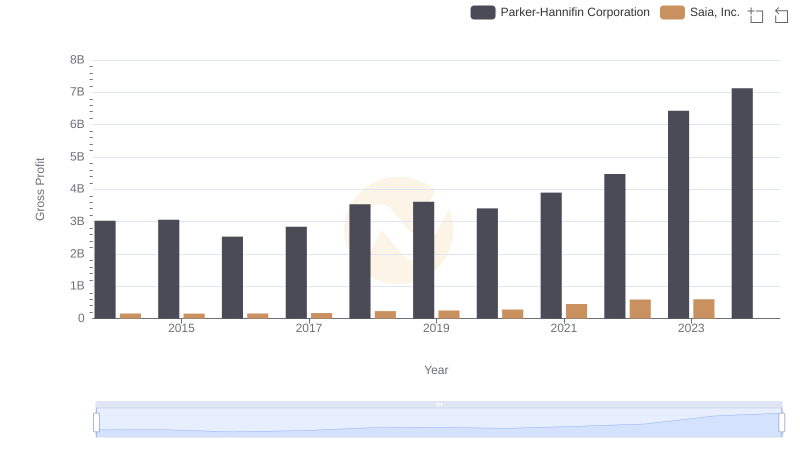
Gross Profit Trends Compared: Parker-Hannifin Corporation vs Saia, Inc.
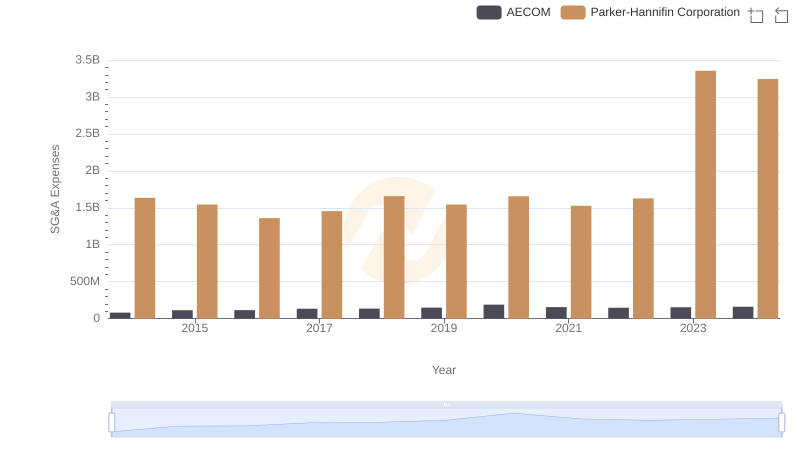
SG&A Efficiency Analysis: Comparing Parker-Hannifin Corporation and AECOM
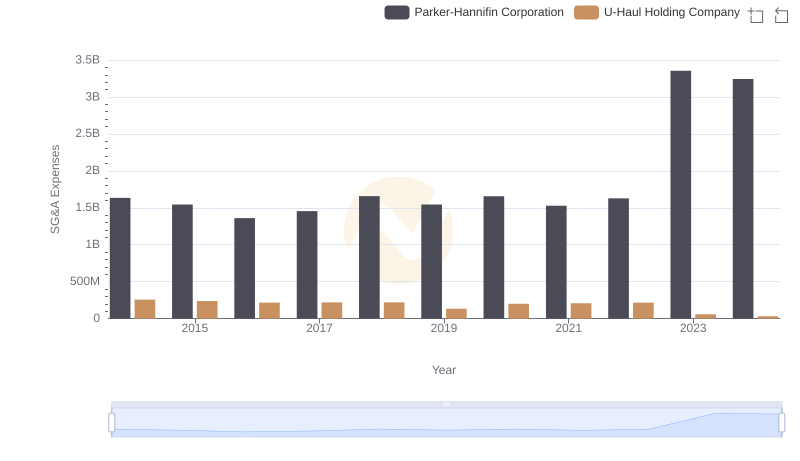
Operational Costs Compared: SG&A Analysis of Parker-Hannifin Corporation and U-Haul Holding Company
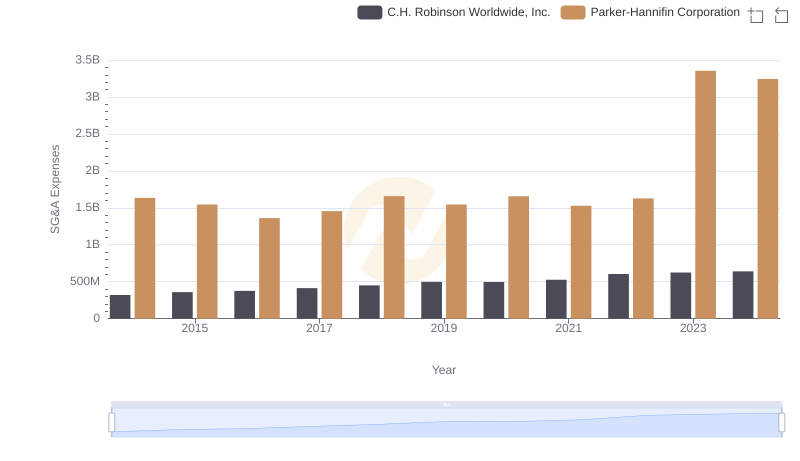
Parker-Hannifin Corporation and C.H. Robinson Worldwide, Inc.: SG&A Spending Patterns Compared
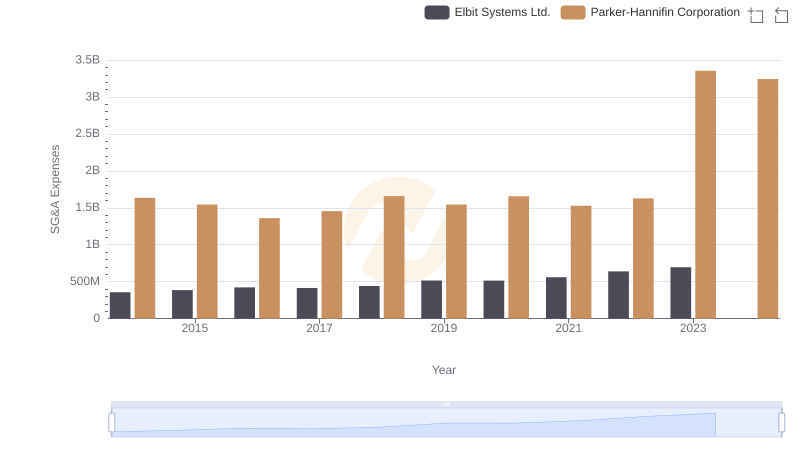
SG&A Efficiency Analysis: Comparing Parker-Hannifin Corporation and Elbit Systems Ltd.
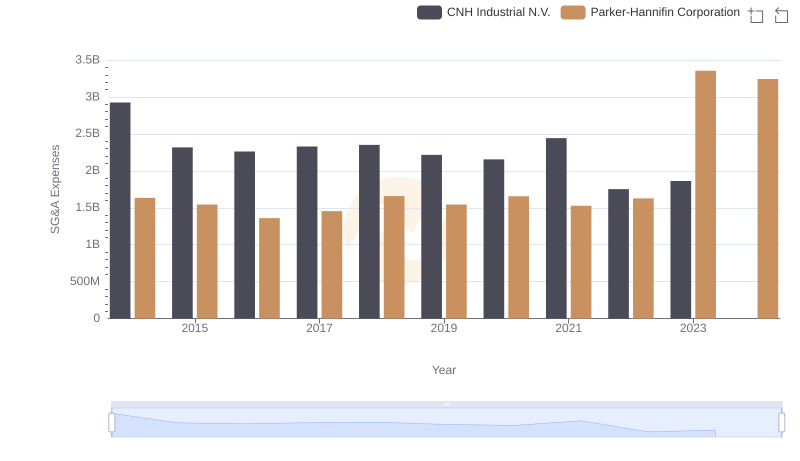
Who Optimizes SG&A Costs Better? Parker-Hannifin Corporation or CNH Industrial N.V.

Selling, General, and Administrative Costs: Parker-Hannifin Corporation vs American Airlines Group Inc.
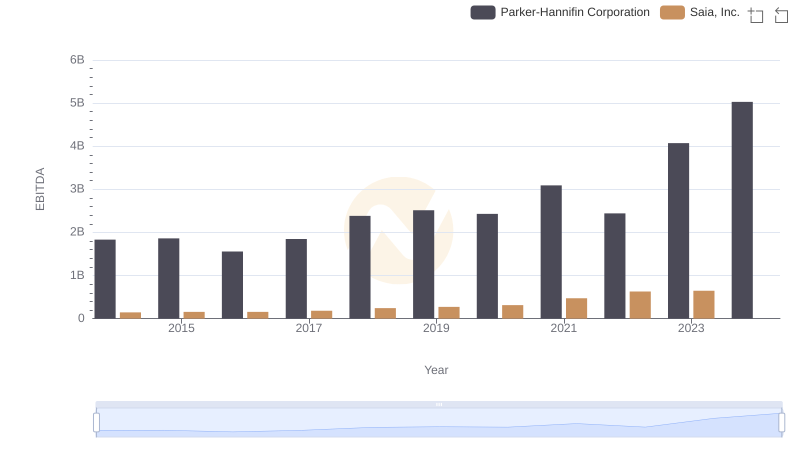
Parker-Hannifin Corporation vs Saia, Inc.: In-Depth EBITDA Performance Comparison