| __timestamp | AECOM | Parker-Hannifin Corporation |
|---|---|---|
| Wednesday, January 1, 2014 | 80908000 | 1633992000 |
| Thursday, January 1, 2015 | 113975000 | 1544746000 |
| Friday, January 1, 2016 | 115088000 | 1359360000 |
| Sunday, January 1, 2017 | 133309000 | 1453935000 |
| Monday, January 1, 2018 | 135787000 | 1657152000 |
| Tuesday, January 1, 2019 | 148123000 | 1543939000 |
| Wednesday, January 1, 2020 | 188535000 | 1656553000 |
| Friday, January 1, 2021 | 155072000 | 1527302000 |
| Saturday, January 1, 2022 | 147309000 | 1627116000 |
| Sunday, January 1, 2023 | 153575000 | 3354103000 |
| Monday, January 1, 2024 | 160105000 | 3315177000 |
Unveiling the hidden dimensions of data
In the competitive landscape of industrial and infrastructure sectors, understanding SG&A (Selling, General, and Administrative) efficiency is crucial. Parker-Hannifin Corporation and AECOM, two industry titans, have shown distinct trends over the past decade. From 2014 to 2024, Parker-Hannifin's SG&A expenses have surged by over 98%, peaking in 2023. This reflects their aggressive expansion and operational scaling. In contrast, AECOM's SG&A expenses have grown by approximately 98% over the same period, indicating a steady yet controlled growth strategy.
Parker-Hannifin's expenses in 2023 were more than double their 2014 figures, highlighting a significant investment in administrative capabilities. Meanwhile, AECOM's expenses, though increasing, have remained relatively stable, suggesting a focus on efficiency. These trends offer a window into each company's strategic priorities and operational dynamics, providing valuable insights for investors and industry analysts alike.
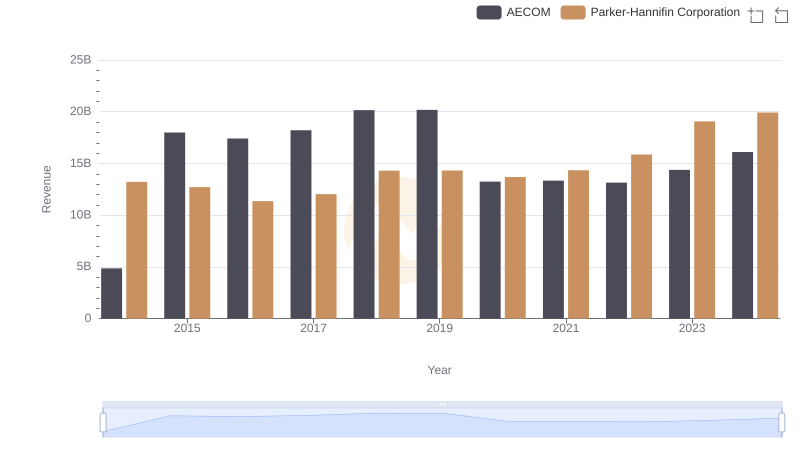
Who Generates More Revenue? Parker-Hannifin Corporation or AECOM
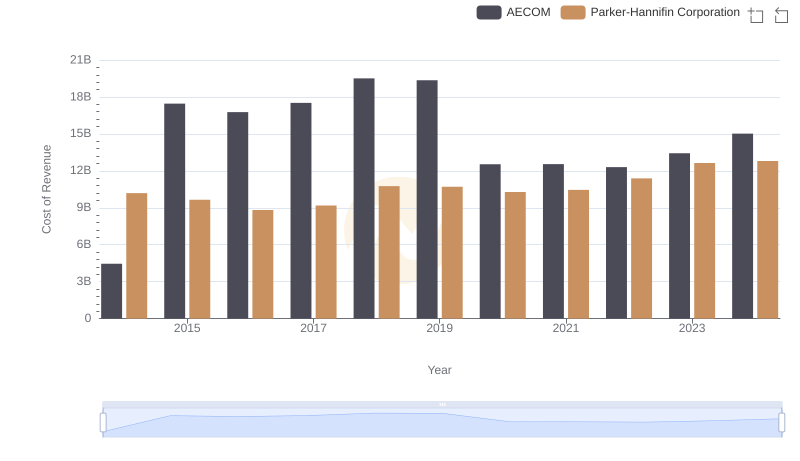
Comparing Cost of Revenue Efficiency: Parker-Hannifin Corporation vs AECOM
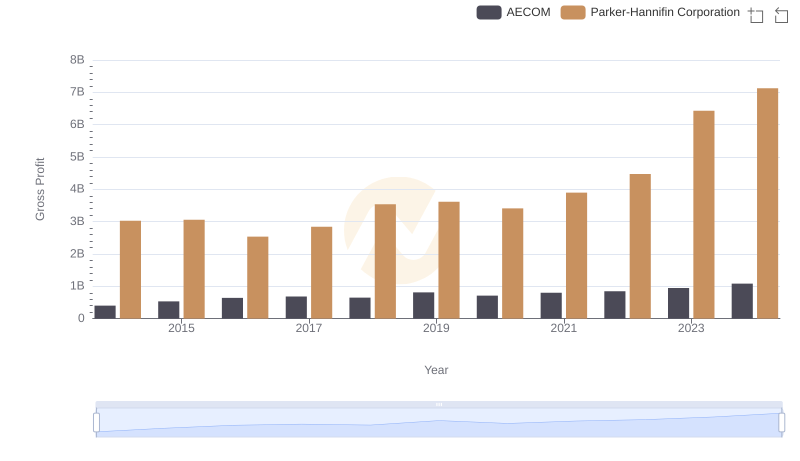
Gross Profit Comparison: Parker-Hannifin Corporation and AECOM Trends
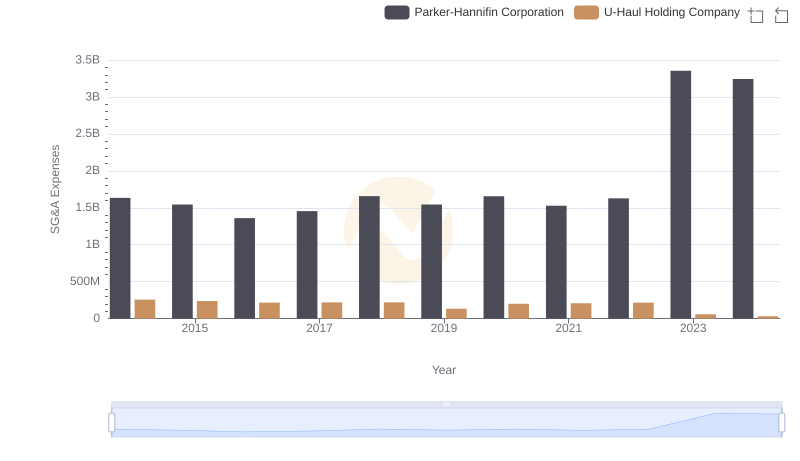
Operational Costs Compared: SG&A Analysis of Parker-Hannifin Corporation and U-Haul Holding Company
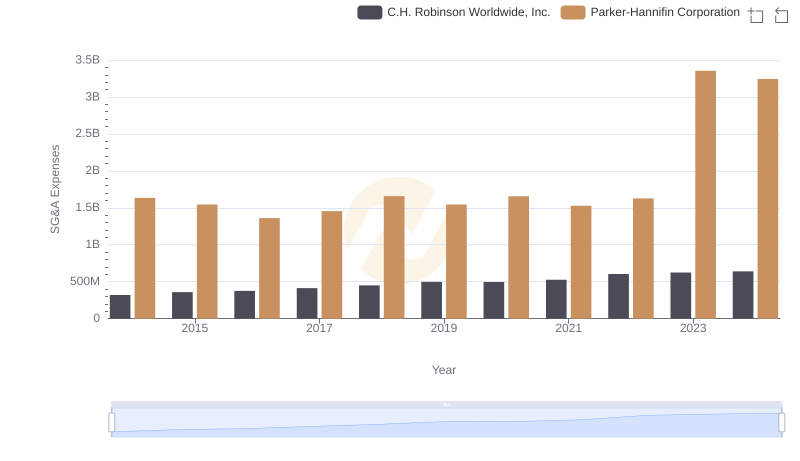
Parker-Hannifin Corporation and C.H. Robinson Worldwide, Inc.: SG&A Spending Patterns Compared
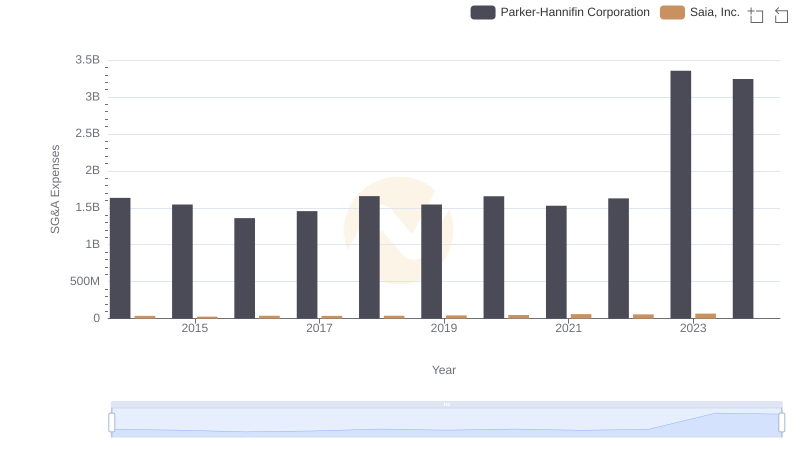
Parker-Hannifin Corporation and Saia, Inc.: SG&A Spending Patterns Compared
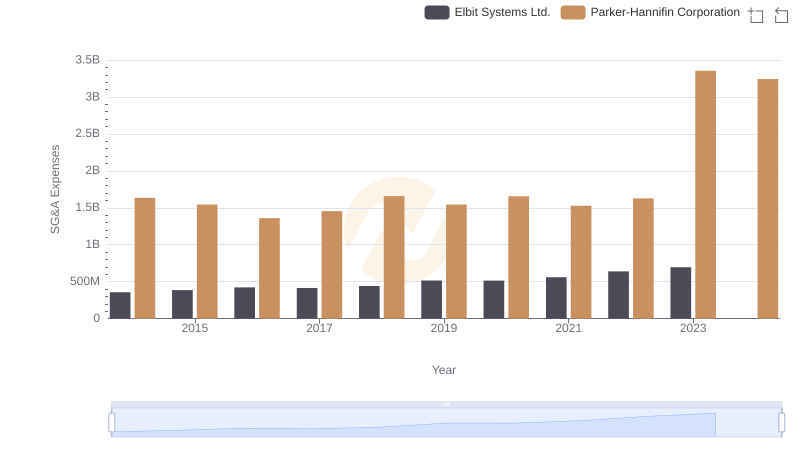
SG&A Efficiency Analysis: Comparing Parker-Hannifin Corporation and Elbit Systems Ltd.
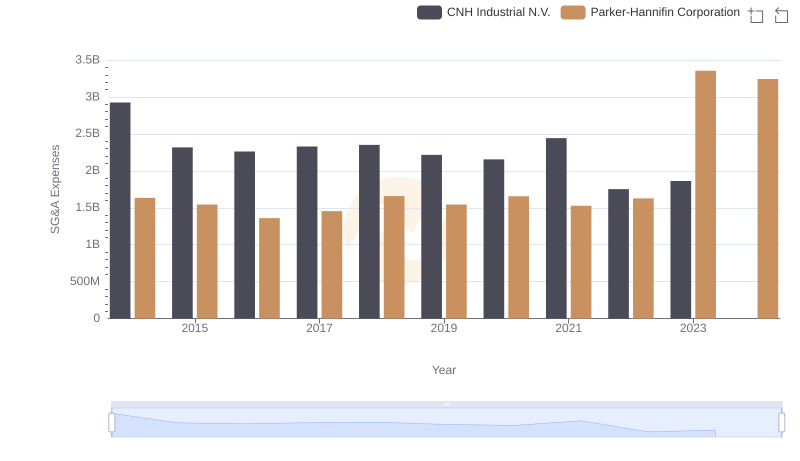
Who Optimizes SG&A Costs Better? Parker-Hannifin Corporation or CNH Industrial N.V.
A Professional Review of EBITDA: Parker-Hannifin Corporation Compared to AECOM

Selling, General, and Administrative Costs: Parker-Hannifin Corporation vs American Airlines Group Inc.