| __timestamp | Intel Corporation | International Business Machines Corporation |
|---|---|---|
| Wednesday, January 1, 2014 | 8136000000 | 22472000000 |
| Thursday, January 1, 2015 | 7930000000 | 19894000000 |
| Friday, January 1, 2016 | 8397000000 | 20279000000 |
| Sunday, January 1, 2017 | 7474000000 | 19680000000 |
| Monday, January 1, 2018 | 6750000000 | 19366000000 |
| Tuesday, January 1, 2019 | 6150000000 | 18724000000 |
| Wednesday, January 1, 2020 | 6180000000 | 20561000000 |
| Friday, January 1, 2021 | 6543000000 | 18745000000 |
| Saturday, January 1, 2022 | 7002000000 | 17483000000 |
| Sunday, January 1, 2023 | 5634000000 | 17997000000 |
| Monday, January 1, 2024 | 5507000000 | 29536000000 |
Cracking the code
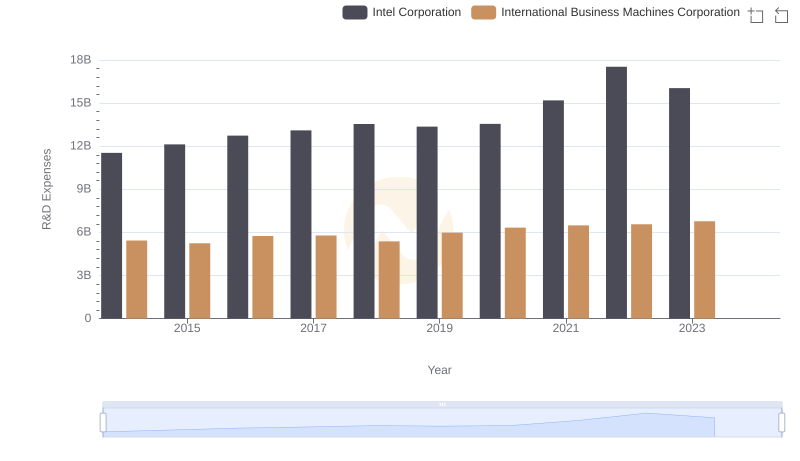
In the ever-evolving tech industry, understanding the financial strategies of giants like IBM and Intel is crucial. Over the past decade, from 2014 to 2023, IBM consistently outspent Intel in Selling, General, and Administrative (SG&A) expenses. IBM's SG&A costs peaked in 2024, reaching nearly 30% higher than its 2014 figures, while Intel's expenses saw a gradual decline, dropping by approximately 30% from 2014 to 2023.
This trend highlights IBM's aggressive investment in administrative and sales strategies, possibly reflecting its focus on maintaining market leadership. In contrast, Intel's more conservative spending could indicate a strategic shift towards efficiency and cost management. Notably, the data for 2024 shows a significant spike for IBM, suggesting a potential strategic pivot or investment surge. Missing data for Intel in 2024 leaves room for speculation on its future financial maneuvers.
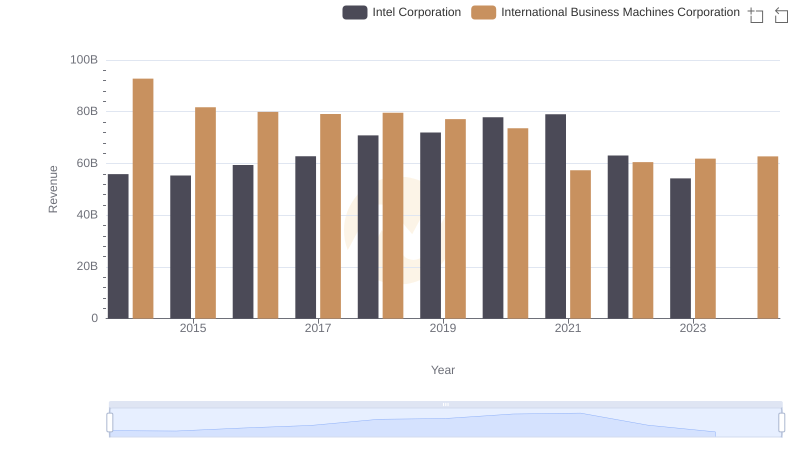
International Business Machines Corporation or Intel Corporation: Who Leads in Yearly Revenue?
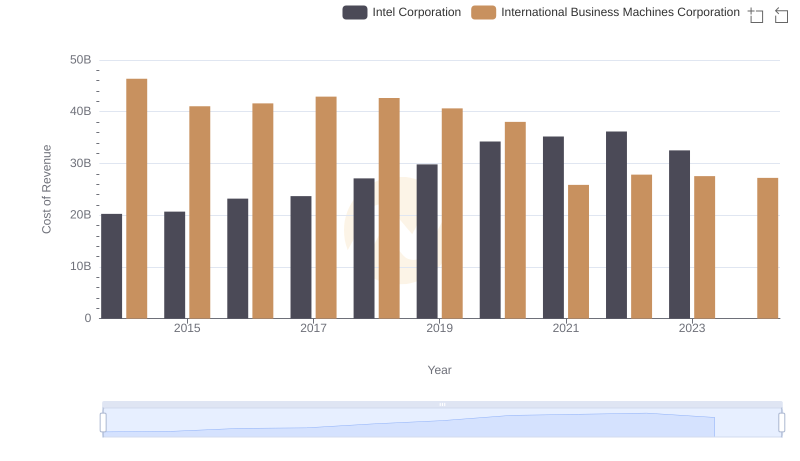
Cost Insights: Breaking Down International Business Machines Corporation and Intel Corporation's Expenses

Gross Profit Analysis: Comparing International Business Machines Corporation and Intel Corporation
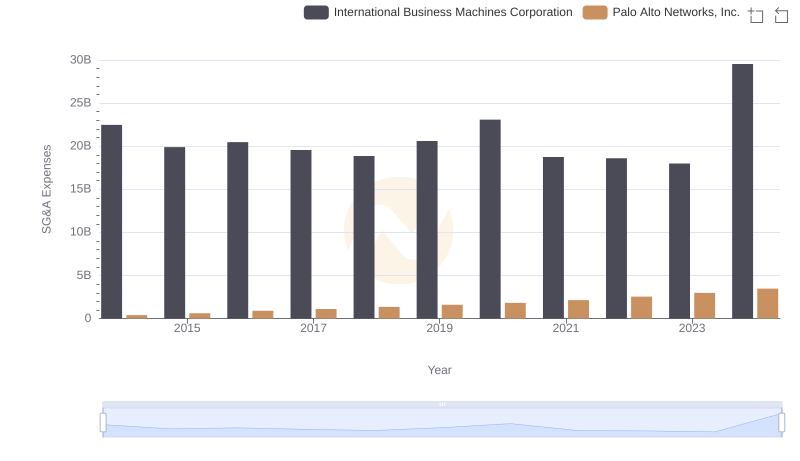
Breaking Down SG&A Expenses: International Business Machines Corporation vs Palo Alto Networks, Inc.
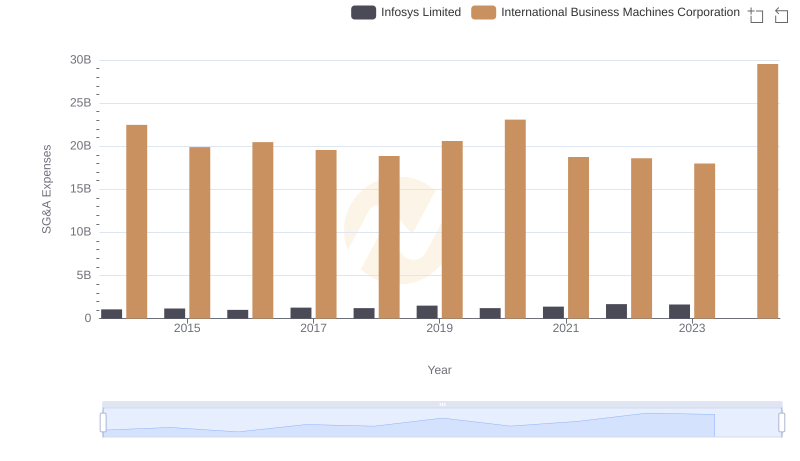
SG&A Efficiency Analysis: Comparing International Business Machines Corporation and Infosys Limited
R&D Spending Showdown: International Business Machines Corporation vs Intel Corporation
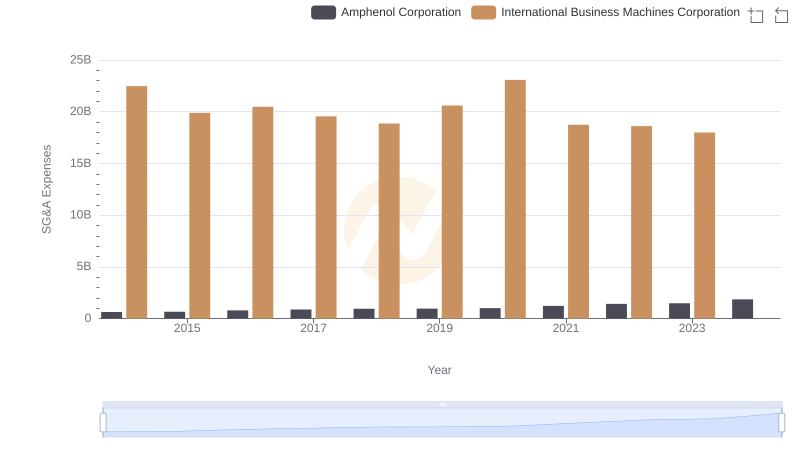
International Business Machines Corporation or Amphenol Corporation: Who Manages SG&A Costs Better?
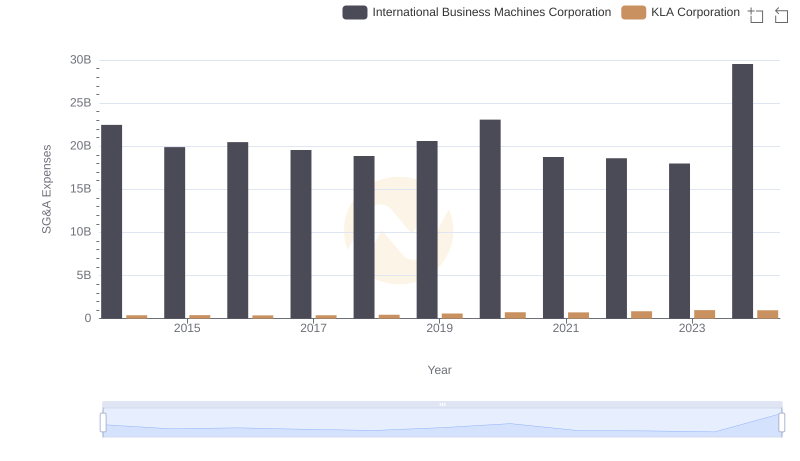
Selling, General, and Administrative Costs: International Business Machines Corporation vs KLA Corporation
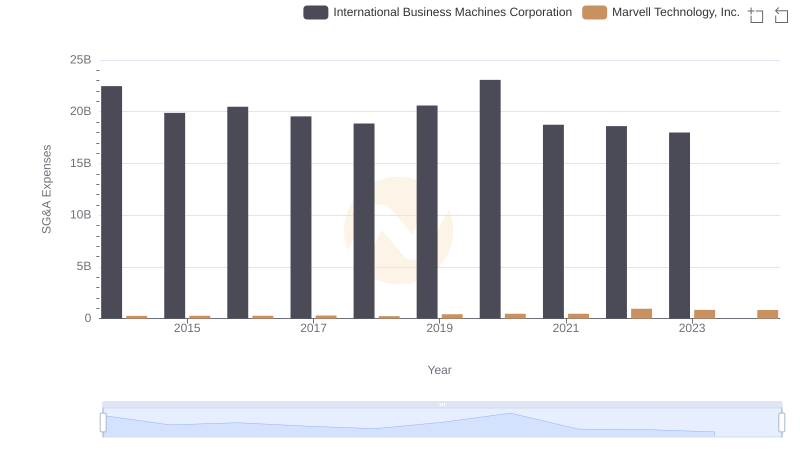
SG&A Efficiency Analysis: Comparing International Business Machines Corporation and Marvell Technology, Inc.
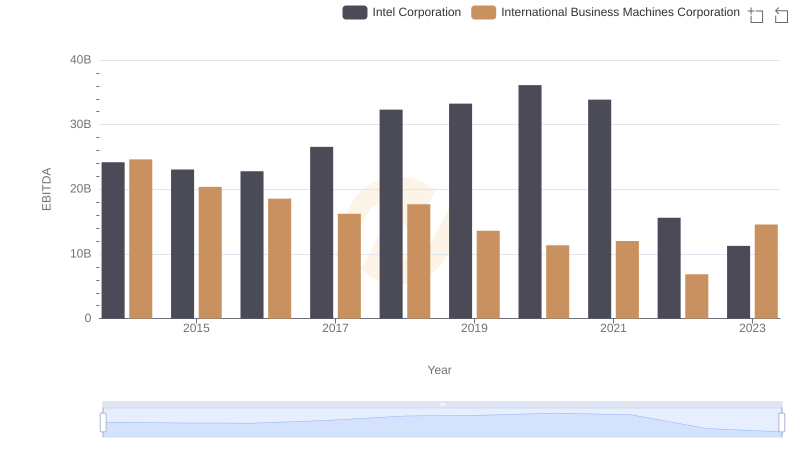
Comparative EBITDA Analysis: International Business Machines Corporation vs Intel Corporation
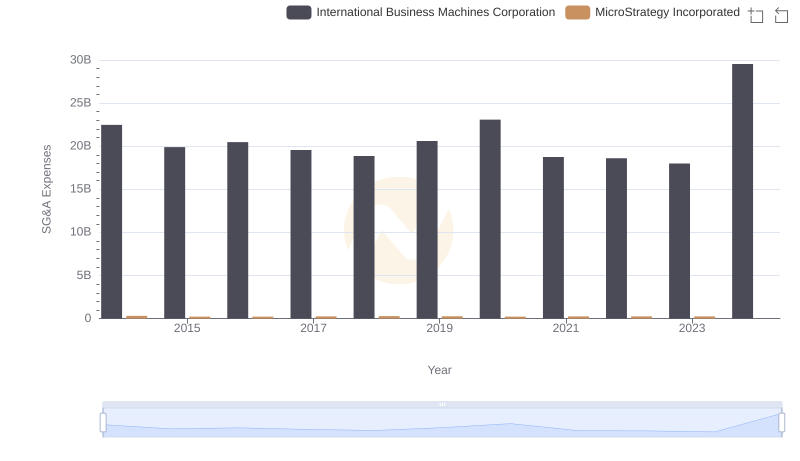
International Business Machines Corporation or MicroStrategy Incorporated: Who Manages SG&A Costs Better?
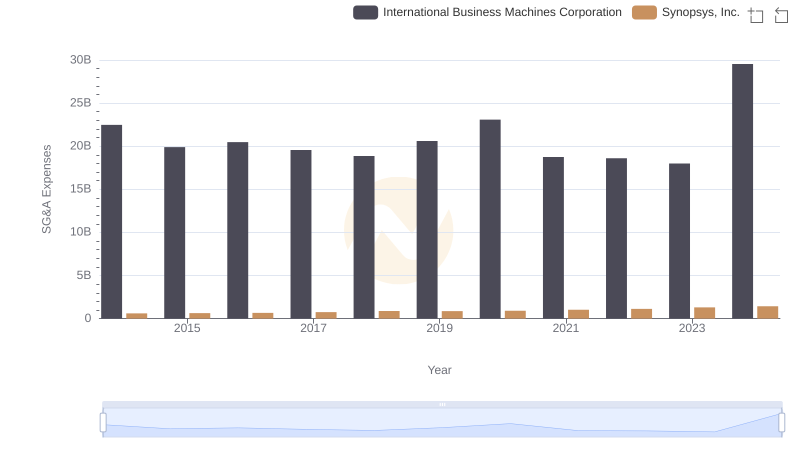
International Business Machines Corporation or Synopsys, Inc.: Who Manages SG&A Costs Better?