| __timestamp | Equifax Inc. | Lennox International Inc. |
|---|---|---|
| Wednesday, January 1, 2014 | 1591700000 | 903300000 |
| Thursday, January 1, 2015 | 1776200000 | 947400000 |
| Friday, January 1, 2016 | 2031500000 | 1076500000 |
| Sunday, January 1, 2017 | 2151500000 | 1125200000 |
| Monday, January 1, 2018 | 1971700000 | 1111200000 |
| Tuesday, January 1, 2019 | 1985900000 | 1079800000 |
| Wednesday, January 1, 2020 | 2390100000 | 1040100000 |
| Friday, January 1, 2021 | 2943000000 | 1188400000 |
| Saturday, January 1, 2022 | 2945000000 | 1284700000 |
| Sunday, January 1, 2023 | 2930100000 | 1547800000 |
| Monday, January 1, 2024 | 5681100000 | 1771900000 |
Unleashing the power of data
In the ever-evolving landscape of corporate finance, understanding the gross profit trends of industry giants like Equifax Inc. and Lennox International Inc. offers valuable insights. From 2014 to 2023, Equifax's gross profit surged by approximately 84%, peaking in 2022 with a remarkable $2.94 billion. This growth reflects a robust expansion strategy and effective cost management. Meanwhile, Lennox International Inc. demonstrated a steady upward trajectory, with a 71% increase over the same period, reaching $1.55 billion in 2023. Notably, Lennox's gross profit continued to rise into 2024, despite missing data for Equifax. This comparison highlights the resilience and adaptability of these companies in a competitive market. As we look to the future, these trends underscore the importance of strategic planning and innovation in maintaining financial health.
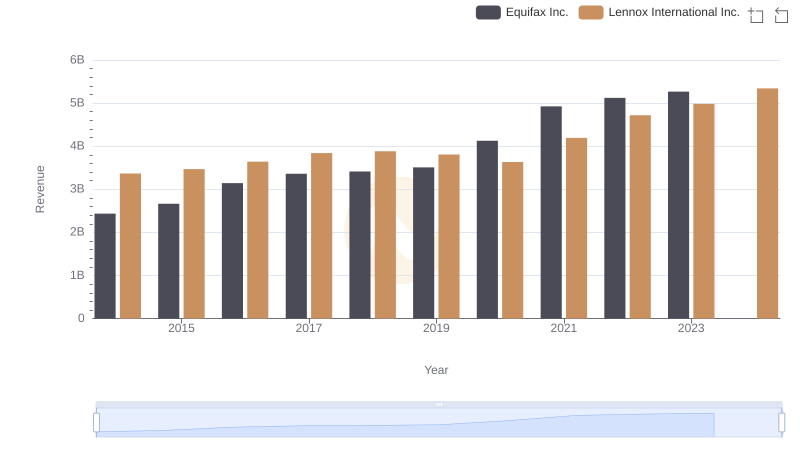
Annual Revenue Comparison: Equifax Inc. vs Lennox International Inc.
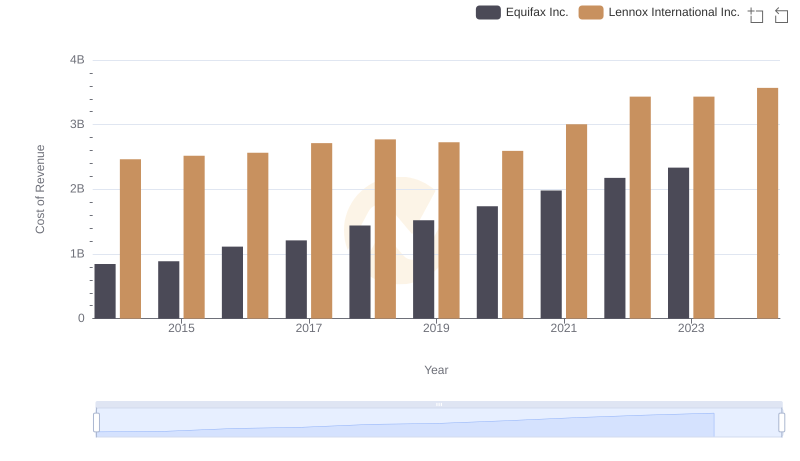
Cost of Revenue Comparison: Equifax Inc. vs Lennox International Inc.
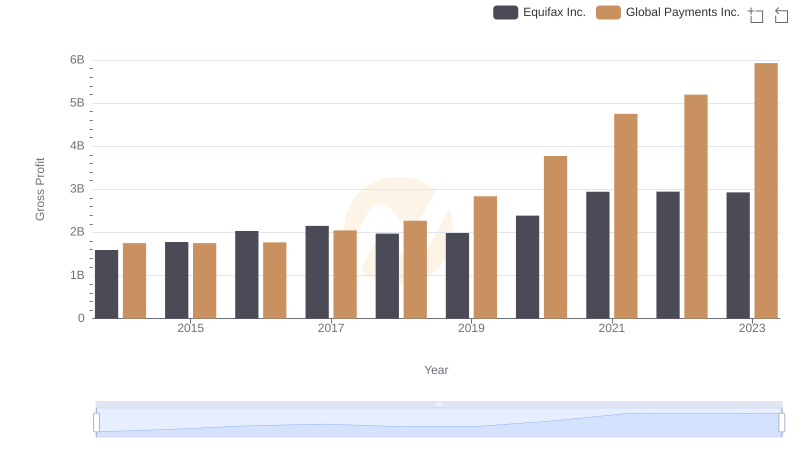
Who Generates Higher Gross Profit? Equifax Inc. or Global Payments Inc.
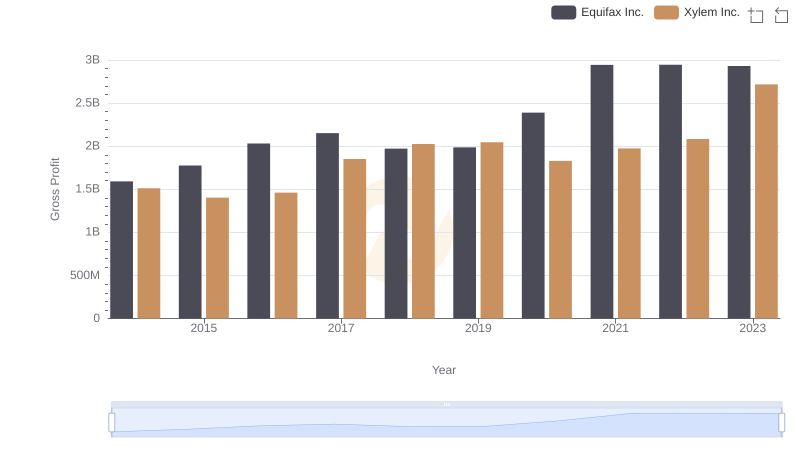
Gross Profit Trends Compared: Equifax Inc. vs Xylem Inc.
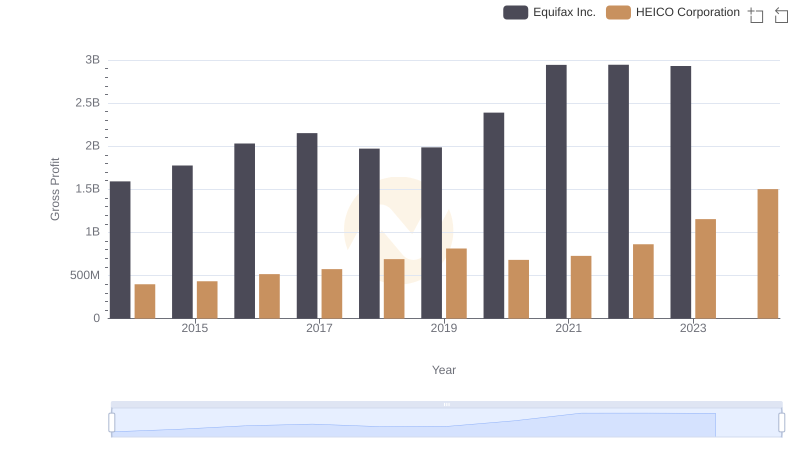
Gross Profit Comparison: Equifax Inc. and HEICO Corporation Trends
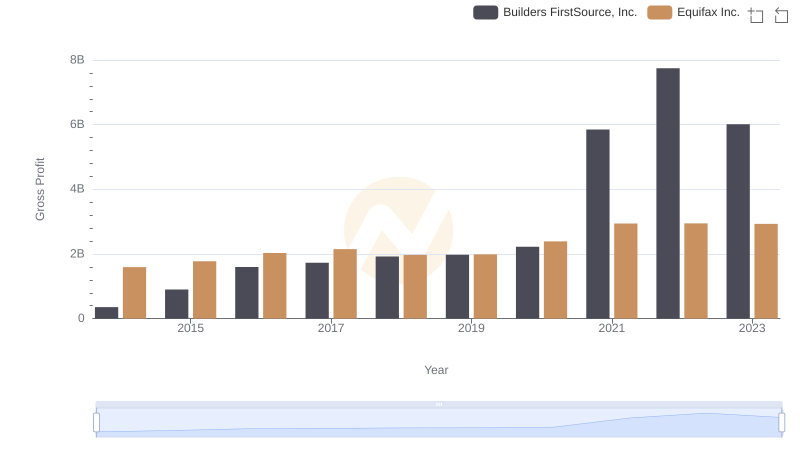
Key Insights on Gross Profit: Equifax Inc. vs Builders FirstSource, Inc.
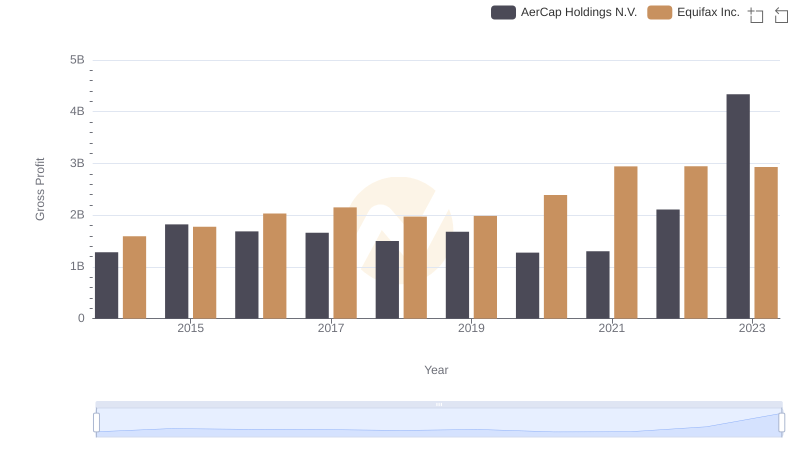
Key Insights on Gross Profit: Equifax Inc. vs AerCap Holdings N.V.
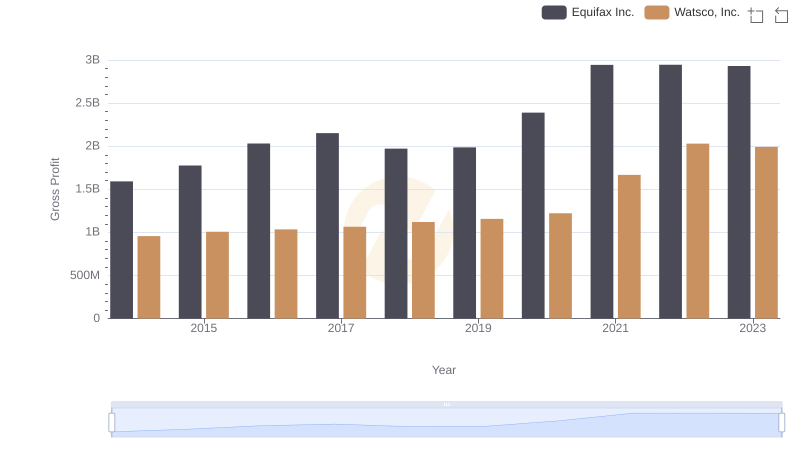
Equifax Inc. vs Watsco, Inc.: A Gross Profit Performance Breakdown
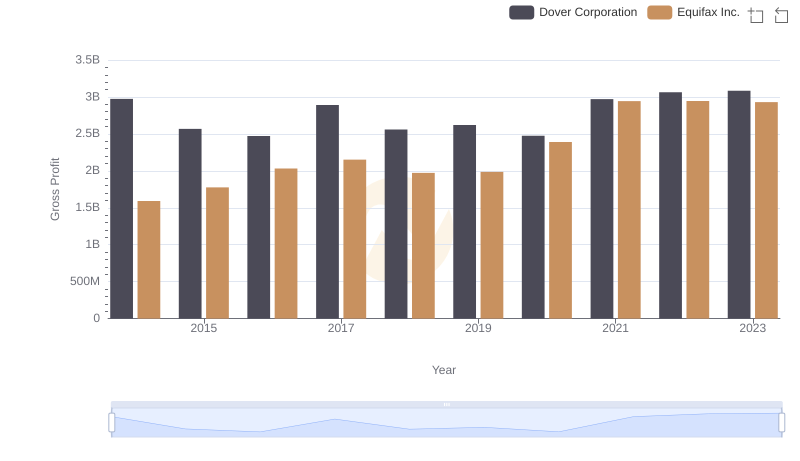
Equifax Inc. vs Dover Corporation: A Gross Profit Performance Breakdown
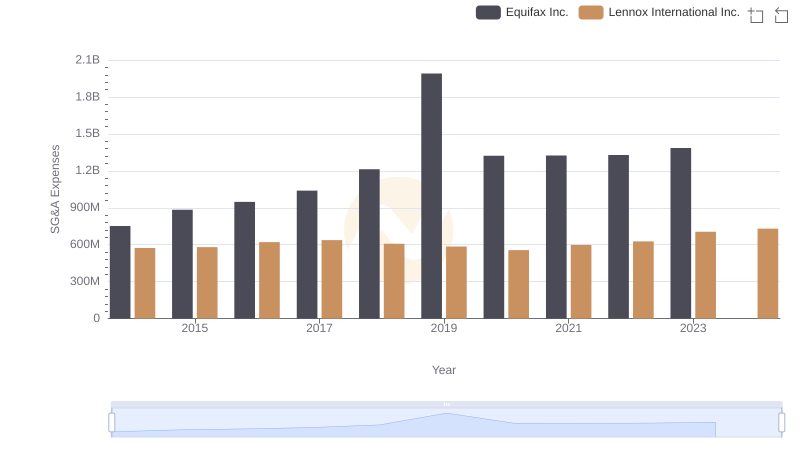
Selling, General, and Administrative Costs: Equifax Inc. vs Lennox International Inc.