| __timestamp | Equifax Inc. | Lennox International Inc. |
|---|---|---|
| Wednesday, January 1, 2014 | 844700000 | 2464100000 |
| Thursday, January 1, 2015 | 887400000 | 2520000000 |
| Friday, January 1, 2016 | 1113400000 | 2565100000 |
| Sunday, January 1, 2017 | 1210700000 | 2714400000 |
| Monday, January 1, 2018 | 1440400000 | 2772700000 |
| Tuesday, January 1, 2019 | 1521700000 | 2727400000 |
| Wednesday, January 1, 2020 | 1737400000 | 2594000000 |
| Friday, January 1, 2021 | 1980900000 | 3005700000 |
| Saturday, January 1, 2022 | 2177200000 | 3433700000 |
| Sunday, January 1, 2023 | 2335100000 | 3434100000 |
| Monday, January 1, 2024 | 0 | 3569400000 |
In pursuit of knowledge
In the ever-evolving landscape of corporate finance, understanding the cost of revenue is crucial for assessing a company's efficiency. This comparison between Equifax Inc. and Lennox International Inc. offers a fascinating glimpse into their financial journeys from 2014 to 2023.
Equifax, a leader in consumer credit reporting, has seen its cost of revenue grow by approximately 176% over the past decade. Starting at 844 million in 2014, it reached a peak of 2.3 billion in 2023. This growth reflects Equifax's expanding operations and investments in data security and technology.
Meanwhile, Lennox International, a key player in the climate control industry, experienced a 39% increase in its cost of revenue, from 2.5 billion in 2014 to 3.4 billion in 2023. This steady rise underscores Lennox's commitment to innovation and market expansion.
While both companies have shown growth, Lennox's cost of revenue remains consistently higher, highlighting its larger scale of operations. Missing data for Equifax in 2024 suggests a need for further analysis.
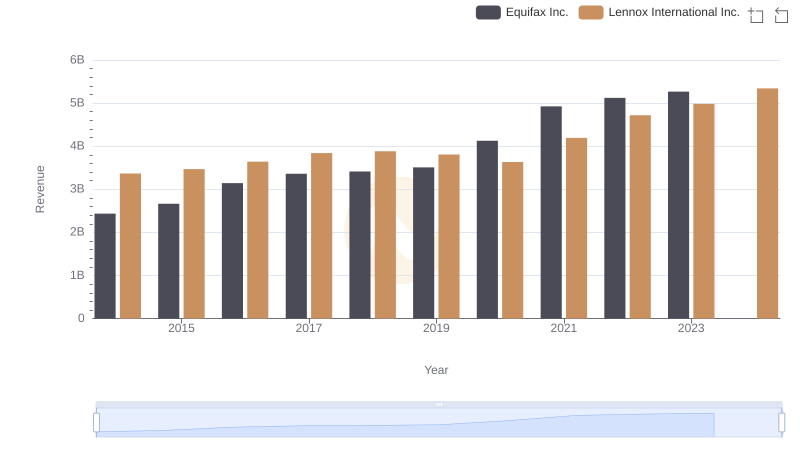
Annual Revenue Comparison: Equifax Inc. vs Lennox International Inc.
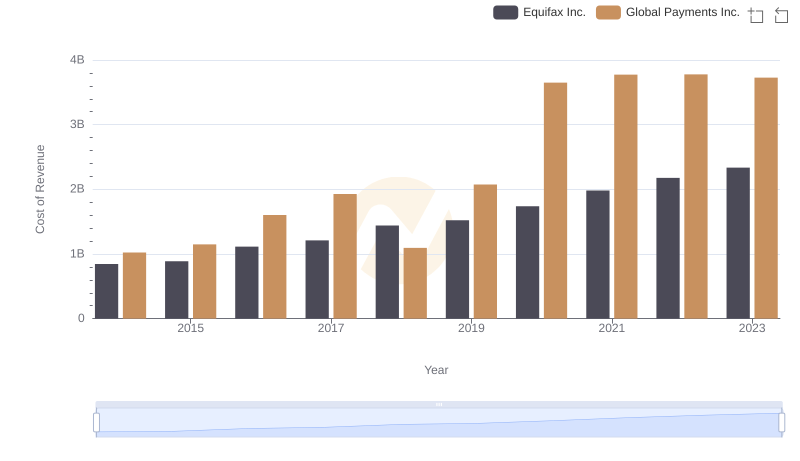
Comparing Cost of Revenue Efficiency: Equifax Inc. vs Global Payments Inc.
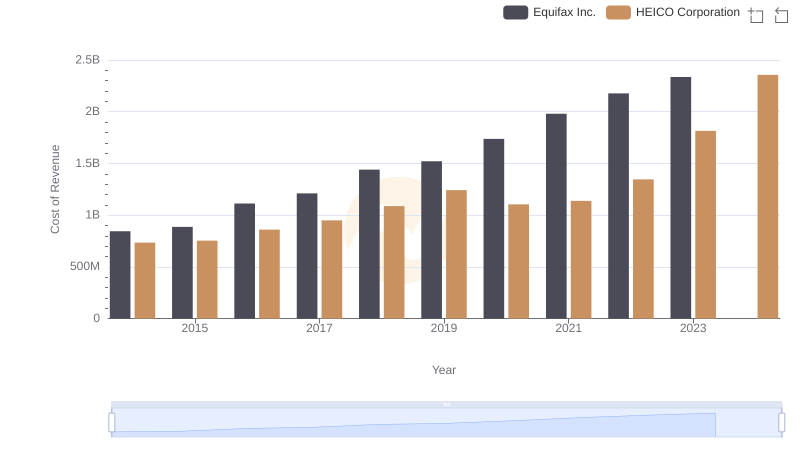
Equifax Inc. vs HEICO Corporation: Efficiency in Cost of Revenue Explored
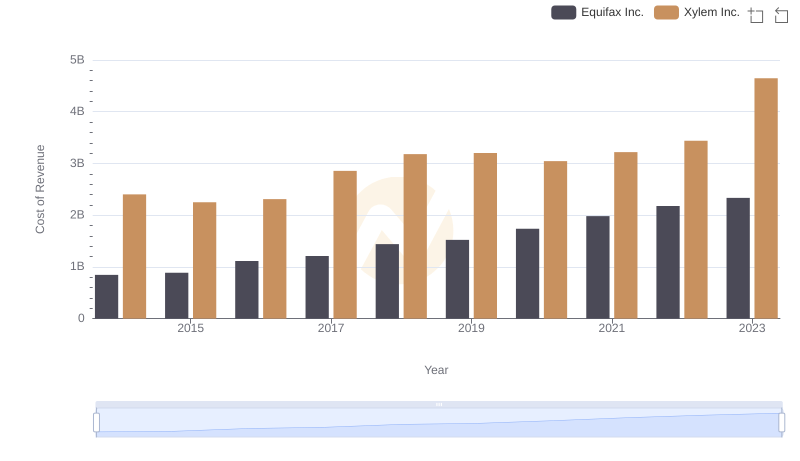
Analyzing Cost of Revenue: Equifax Inc. and Xylem Inc.
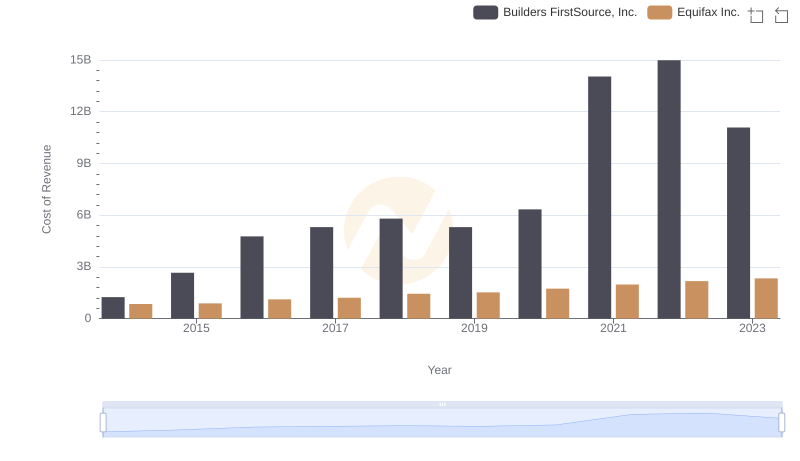
Cost Insights: Breaking Down Equifax Inc. and Builders FirstSource, Inc.'s Expenses
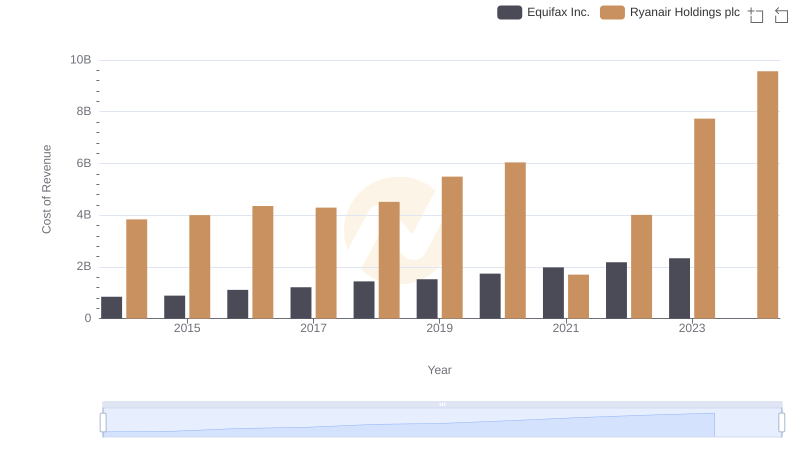
Equifax Inc. vs Ryanair Holdings plc: Efficiency in Cost of Revenue Explored
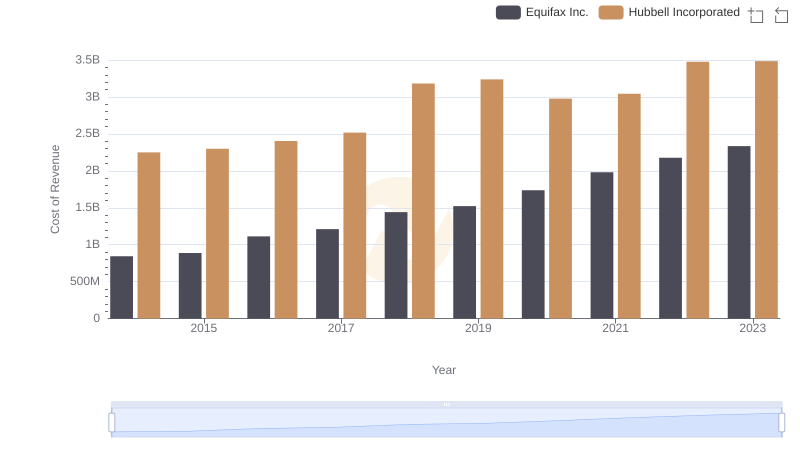
Cost Insights: Breaking Down Equifax Inc. and Hubbell Incorporated's Expenses
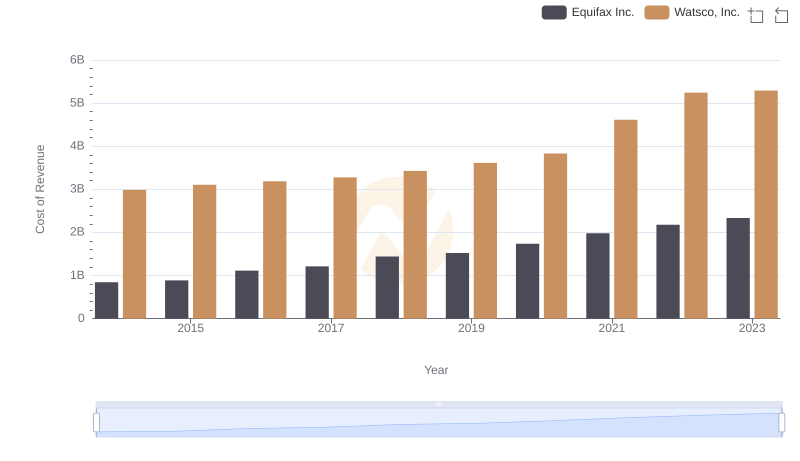
Cost of Revenue: Key Insights for Equifax Inc. and Watsco, Inc.
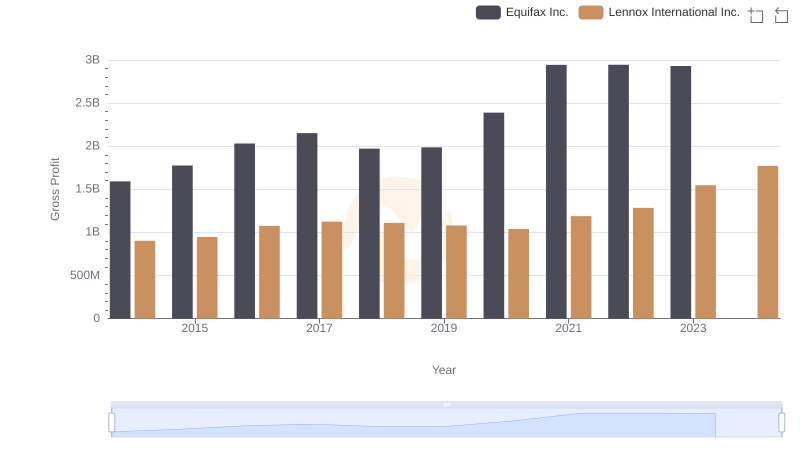
Equifax Inc. vs Lennox International Inc.: A Gross Profit Performance Breakdown
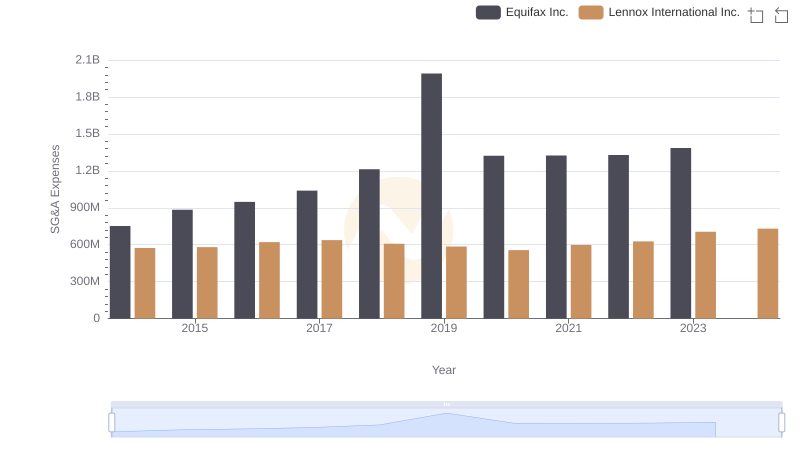
Selling, General, and Administrative Costs: Equifax Inc. vs Lennox International Inc.