| __timestamp | Comfort Systems USA, Inc. | Rockwell Automation, Inc. |
|---|---|---|
| Wednesday, January 1, 2014 | 249771000 | 2753900000 |
| Thursday, January 1, 2015 | 318129000 | 2703100000 |
| Friday, January 1, 2016 | 344009000 | 2475500000 |
| Sunday, January 1, 2017 | 366281000 | 2624200000 |
| Monday, January 1, 2018 | 446279000 | 2872200000 |
| Tuesday, January 1, 2019 | 501943000 | 2900100000 |
| Wednesday, January 1, 2020 | 546983000 | 2595200000 |
| Friday, January 1, 2021 | 563207000 | 2897700000 |
| Saturday, January 1, 2022 | 741608000 | 3102000000 |
| Sunday, January 1, 2023 | 990509000 | 3717000000 |
| Monday, January 1, 2024 | 3193400000 |
Infusing magic into the data realm
In the competitive landscape of industrial automation and building systems, Rockwell Automation, Inc. and Comfort Systems USA, Inc. have showcased distinct trajectories in gross profit over the past decade. From 2014 to 2023, Rockwell Automation consistently outperformed, with gross profits peaking at approximately $3.7 billion in 2023, marking a 35% increase from 2014. Meanwhile, Comfort Systems USA demonstrated impressive growth, with gross profits surging nearly 300% from 2014 to 2023, reaching close to $990 million. This remarkable growth highlights Comfort Systems' strategic advancements in the building systems sector. However, the data for 2024 remains incomplete, leaving room for speculation on future trends. As these industry leaders continue to innovate, their financial performances offer valuable insights into the evolving dynamics of their respective markets.
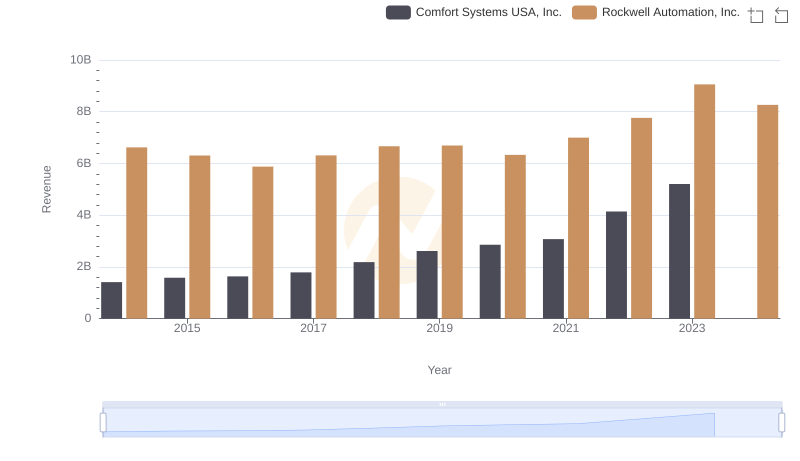
Comparing Revenue Performance: Rockwell Automation, Inc. or Comfort Systems USA, Inc.?
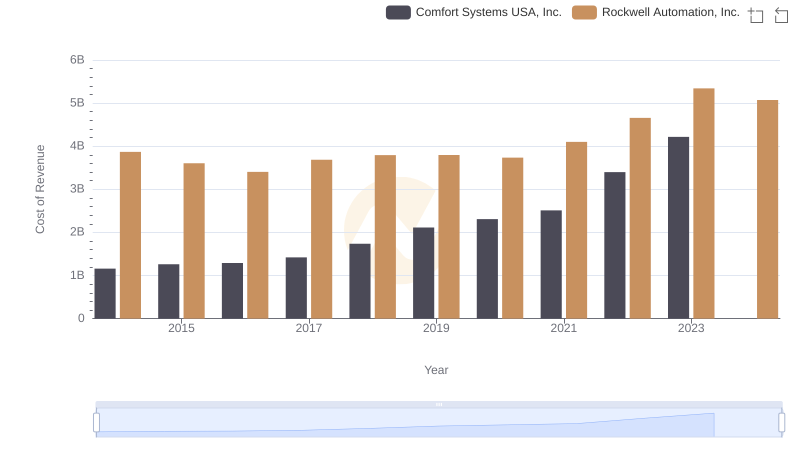
Cost of Revenue: Key Insights for Rockwell Automation, Inc. and Comfort Systems USA, Inc.
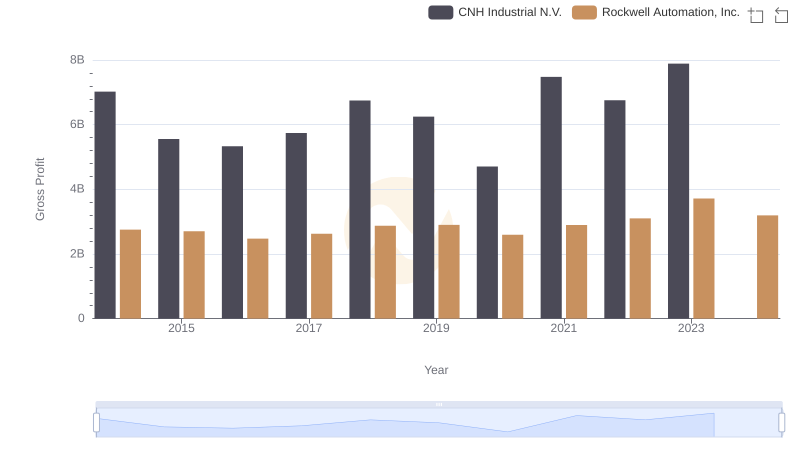
Rockwell Automation, Inc. and CNH Industrial N.V.: A Detailed Gross Profit Analysis
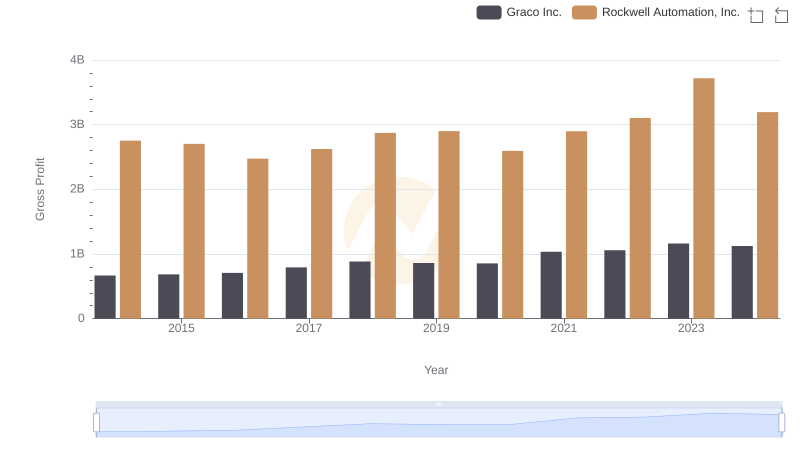
Gross Profit Trends Compared: Rockwell Automation, Inc. vs Graco Inc.
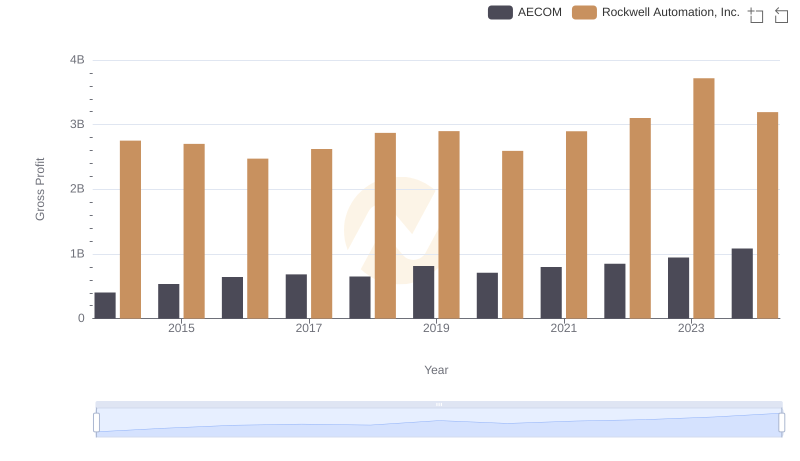
Gross Profit Analysis: Comparing Rockwell Automation, Inc. and AECOM
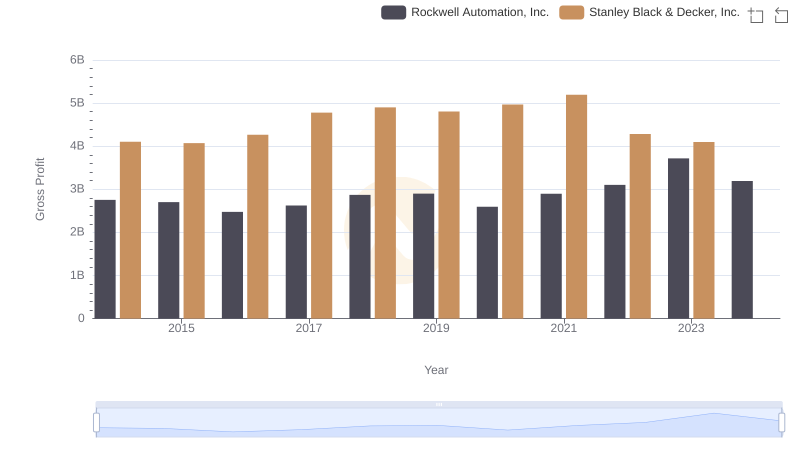
Who Generates Higher Gross Profit? Rockwell Automation, Inc. or Stanley Black & Decker, Inc.
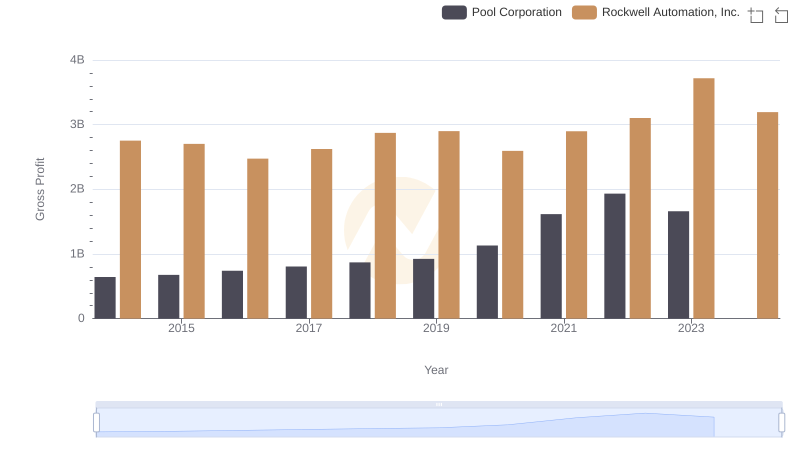
Rockwell Automation, Inc. and Pool Corporation: A Detailed Gross Profit Analysis
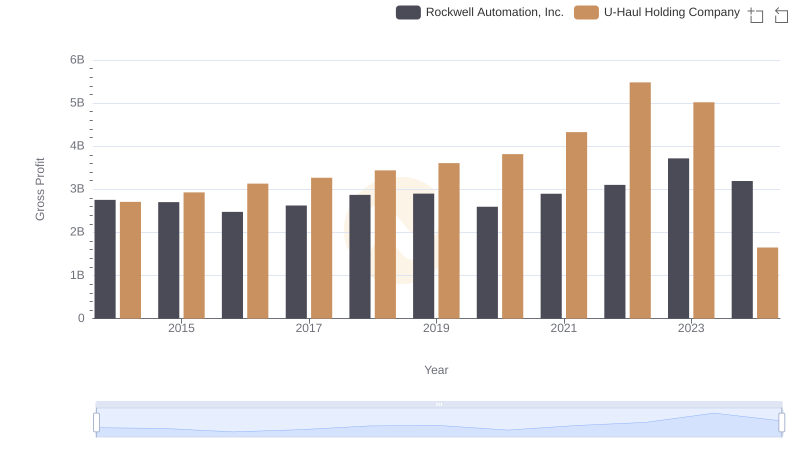
Who Generates Higher Gross Profit? Rockwell Automation, Inc. or U-Haul Holding Company
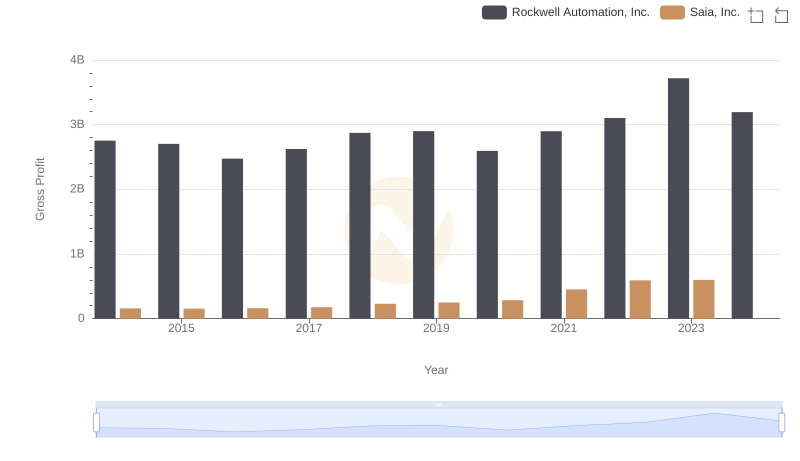
Key Insights on Gross Profit: Rockwell Automation, Inc. vs Saia, Inc.
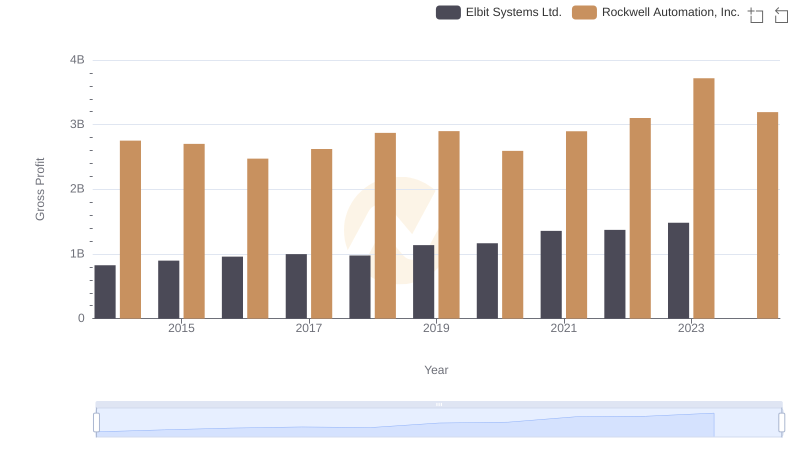
Rockwell Automation, Inc. vs Elbit Systems Ltd.: A Gross Profit Performance Breakdown
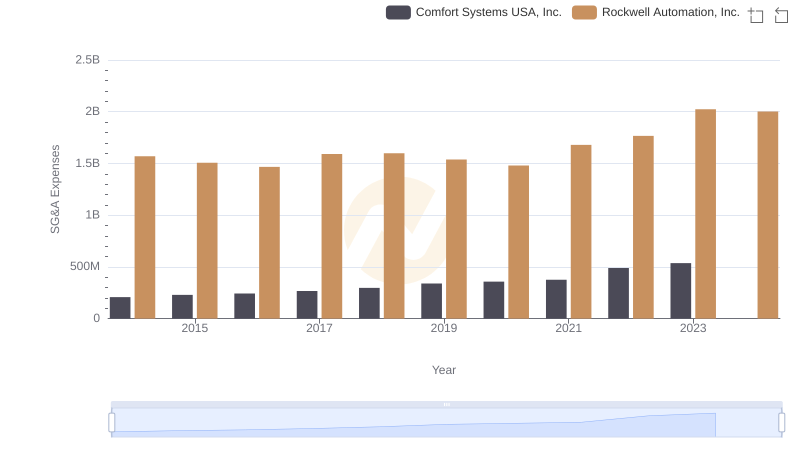
SG&A Efficiency Analysis: Comparing Rockwell Automation, Inc. and Comfort Systems USA, Inc.
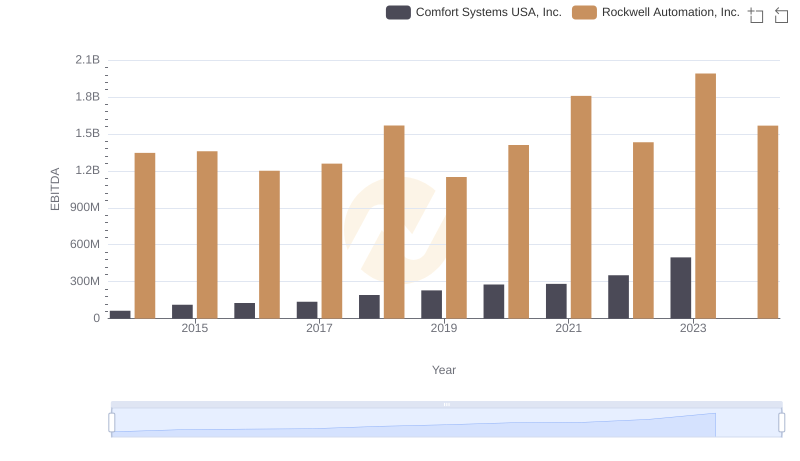
EBITDA Metrics Evaluated: Rockwell Automation, Inc. vs Comfort Systems USA, Inc.