| __timestamp | Comfort Systems USA, Inc. | Rockwell Automation, Inc. |
|---|---|---|
| Wednesday, January 1, 2014 | 1410795000 | 6623500000 |
| Thursday, January 1, 2015 | 1580519000 | 6307900000 |
| Friday, January 1, 2016 | 1634340000 | 5879500000 |
| Sunday, January 1, 2017 | 1787922000 | 6311300000 |
| Monday, January 1, 2018 | 2182879000 | 6666000000 |
| Tuesday, January 1, 2019 | 2615277000 | 6694800000 |
| Wednesday, January 1, 2020 | 2856659000 | 6329800000 |
| Friday, January 1, 2021 | 3073636000 | 6997400000 |
| Saturday, January 1, 2022 | 4140364000 | 7760400000 |
| Sunday, January 1, 2023 | 5206760000 | 9058000000 |
| Monday, January 1, 2024 | 8264200000 |
In pursuit of knowledge
In the competitive landscape of industrial automation and building services, Rockwell Automation and Comfort Systems USA have showcased distinct revenue trajectories over the past decade. From 2014 to 2023, Rockwell Automation consistently outperformed, with revenues peaking at approximately $9 billion in 2023, marking a 37% increase from 2014. Comfort Systems USA, while starting at a lower base, demonstrated impressive growth, with revenues surging by 269% to over $5 billion in the same period. This growth narrative highlights Comfort Systems USA's aggressive expansion strategy, while Rockwell Automation's steady climb underscores its market dominance. Notably, 2024 data for Comfort Systems USA is missing, leaving room for speculation on its future performance. As these industry giants continue to evolve, their revenue trends offer valuable insights into their strategic directions and market positions.
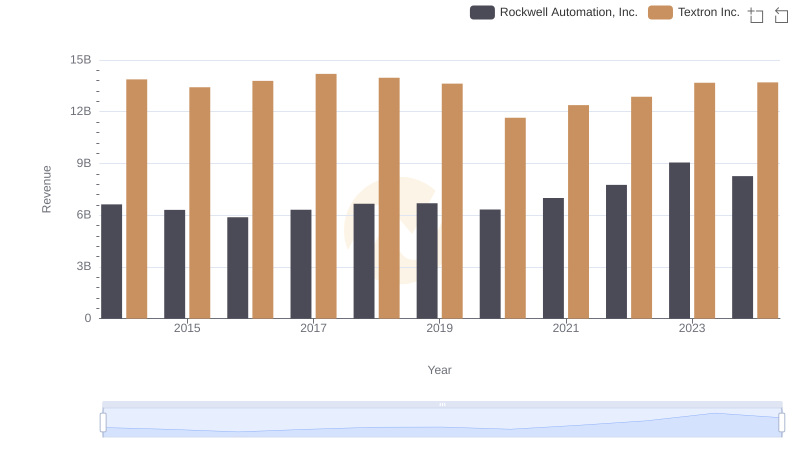
Who Generates More Revenue? Rockwell Automation, Inc. or Textron Inc.
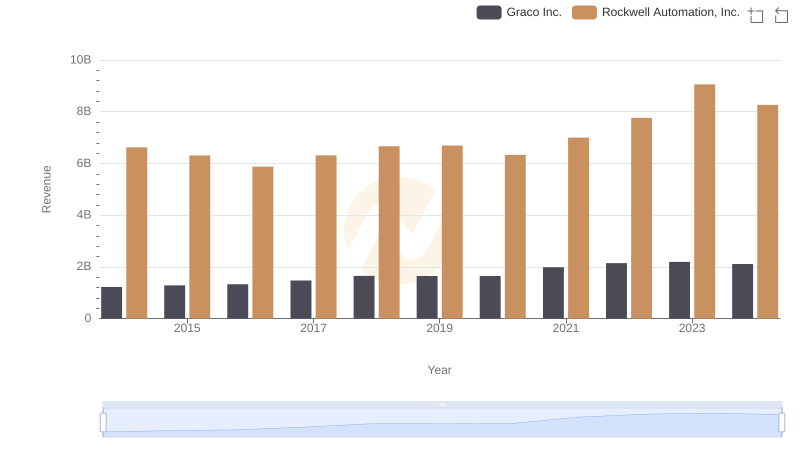
Rockwell Automation, Inc. vs Graco Inc.: Examining Key Revenue Metrics

Revenue Showdown: Rockwell Automation, Inc. vs CNH Industrial N.V.
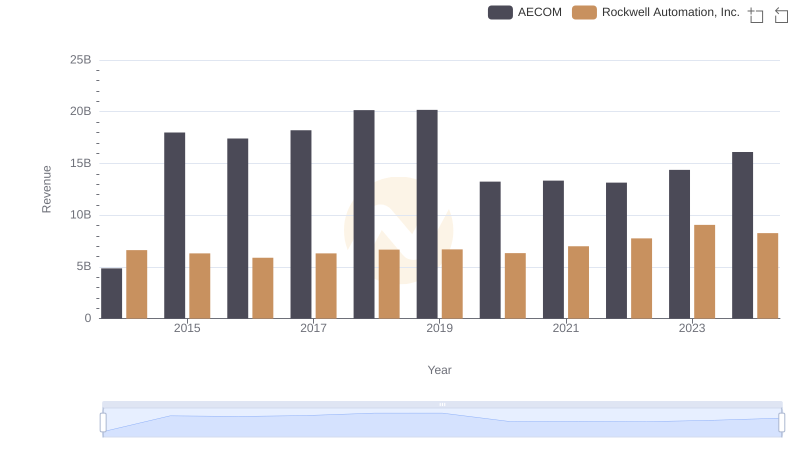
Breaking Down Revenue Trends: Rockwell Automation, Inc. vs AECOM

Revenue Showdown: Rockwell Automation, Inc. vs Saia, Inc.
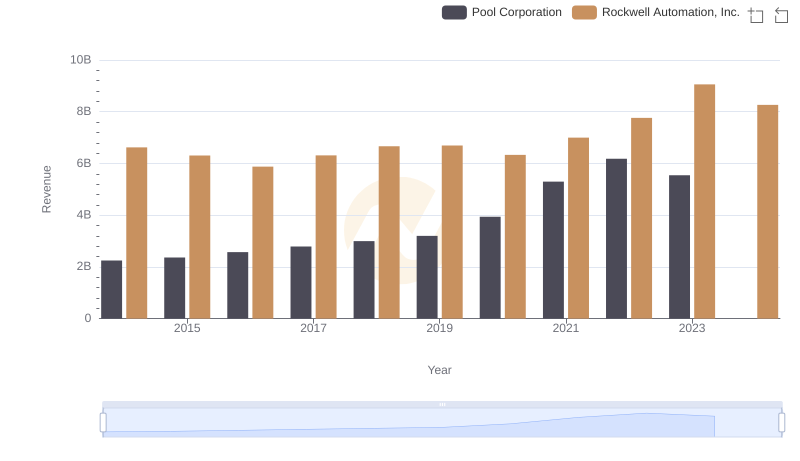
Annual Revenue Comparison: Rockwell Automation, Inc. vs Pool Corporation
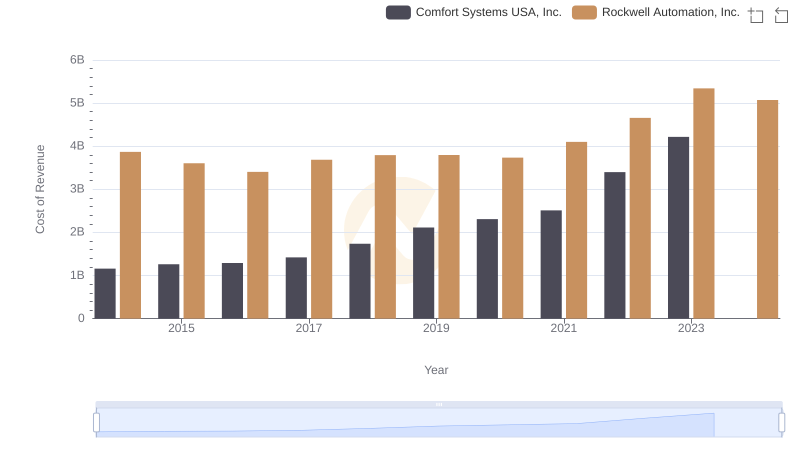
Cost of Revenue: Key Insights for Rockwell Automation, Inc. and Comfort Systems USA, Inc.
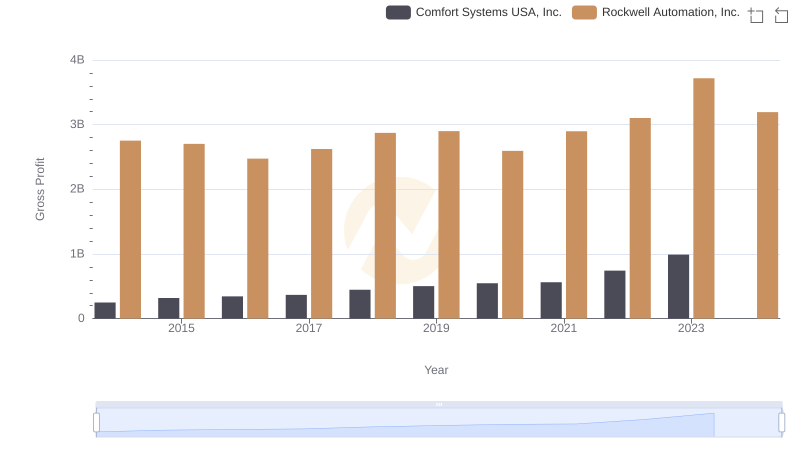
Rockwell Automation, Inc. vs Comfort Systems USA, Inc.: A Gross Profit Performance Breakdown
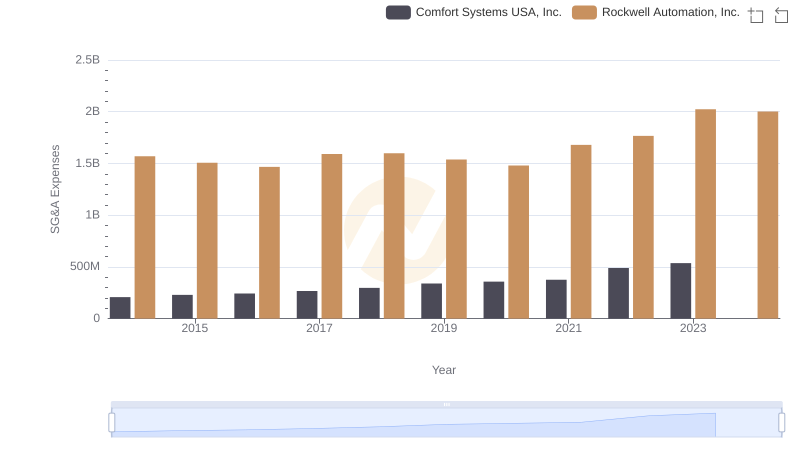
SG&A Efficiency Analysis: Comparing Rockwell Automation, Inc. and Comfort Systems USA, Inc.
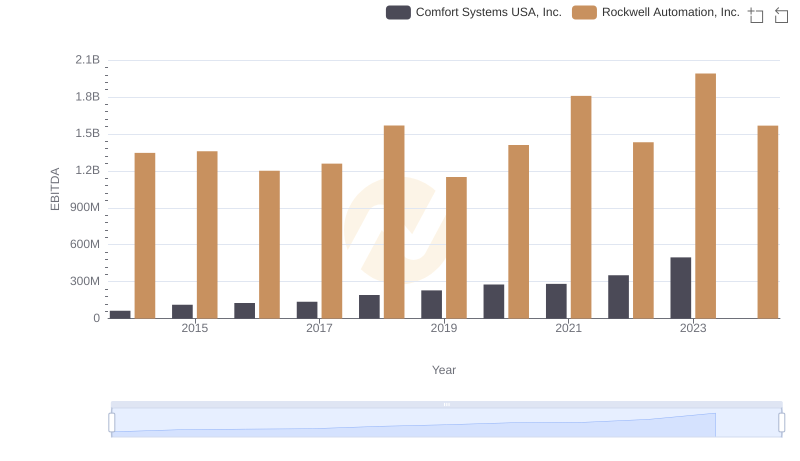
EBITDA Metrics Evaluated: Rockwell Automation, Inc. vs Comfort Systems USA, Inc.