| __timestamp | CNH Industrial N.V. | Rockwell Automation, Inc. |
|---|---|---|
| Wednesday, January 1, 2014 | 7021000000 | 2753900000 |
| Thursday, January 1, 2015 | 5555000000 | 2703100000 |
| Friday, January 1, 2016 | 5333000000 | 2475500000 |
| Sunday, January 1, 2017 | 5740000000 | 2624200000 |
| Monday, January 1, 2018 | 6748000000 | 2872200000 |
| Tuesday, January 1, 2019 | 6247000000 | 2900100000 |
| Wednesday, January 1, 2020 | 4705000000 | 2595200000 |
| Friday, January 1, 2021 | 7477000000 | 2897700000 |
| Saturday, January 1, 2022 | 6754000000 | 3102000000 |
| Sunday, January 1, 2023 | 7889000000 | 3717000000 |
| Monday, January 1, 2024 | 3193400000 |
Data in motion
In the ever-evolving landscape of industrial automation and machinery, Rockwell Automation, Inc. and CNH Industrial N.V. stand as titans. Over the past decade, these companies have showcased intriguing trends in their gross profits. From 2014 to 2023, CNH Industrial N.V. experienced a rollercoaster ride, with gross profits peaking in 2023 at approximately 7.9 billion, a 12% increase from 2014. Meanwhile, Rockwell Automation, Inc. demonstrated a steady upward trajectory, culminating in a 35% rise in gross profit by 2023, reaching around 3.7 billion.
The data reveals a fascinating narrative of resilience and growth, with Rockwell Automation, Inc. consistently closing the gap with its larger competitor. Notably, 2020 marked a challenging year for both, with CNH Industrial N.V. hitting a low point. However, the subsequent recovery underscores the sector's robust adaptability and potential for future growth.

Revenue Showdown: Rockwell Automation, Inc. vs CNH Industrial N.V.
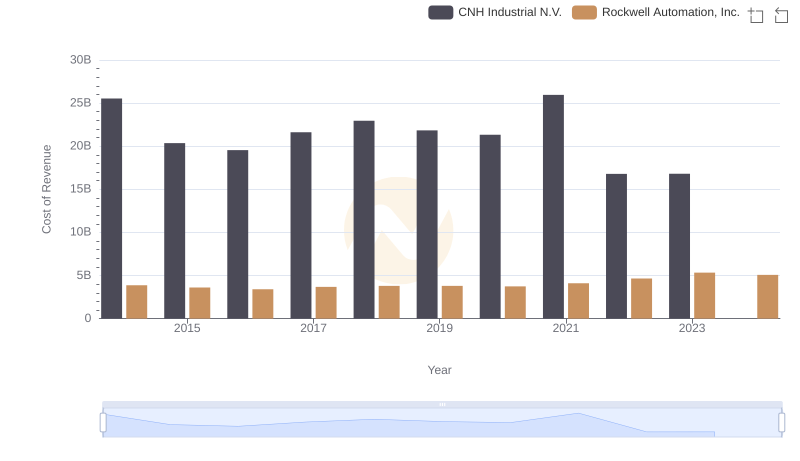
Comparing Cost of Revenue Efficiency: Rockwell Automation, Inc. vs CNH Industrial N.V.
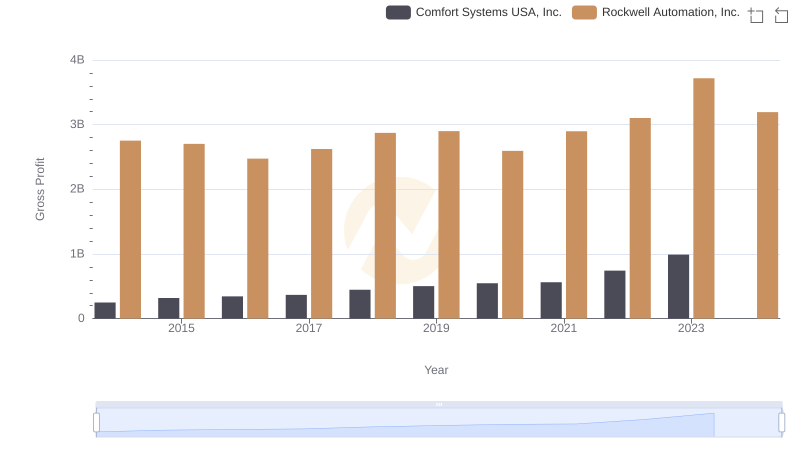
Rockwell Automation, Inc. vs Comfort Systems USA, Inc.: A Gross Profit Performance Breakdown
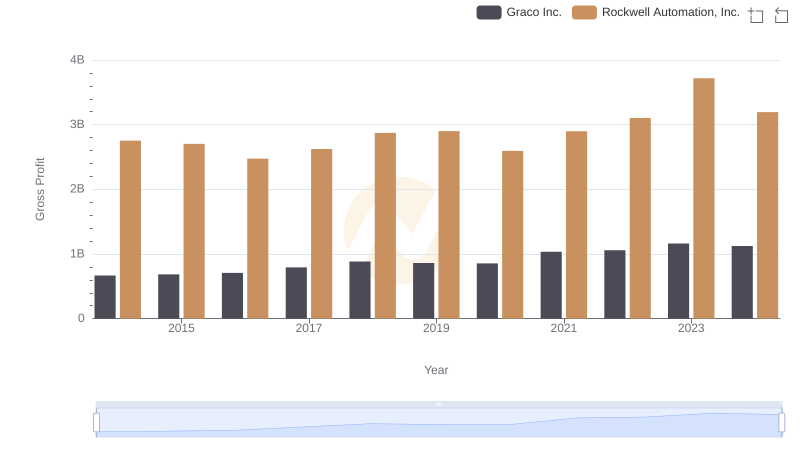
Gross Profit Trends Compared: Rockwell Automation, Inc. vs Graco Inc.
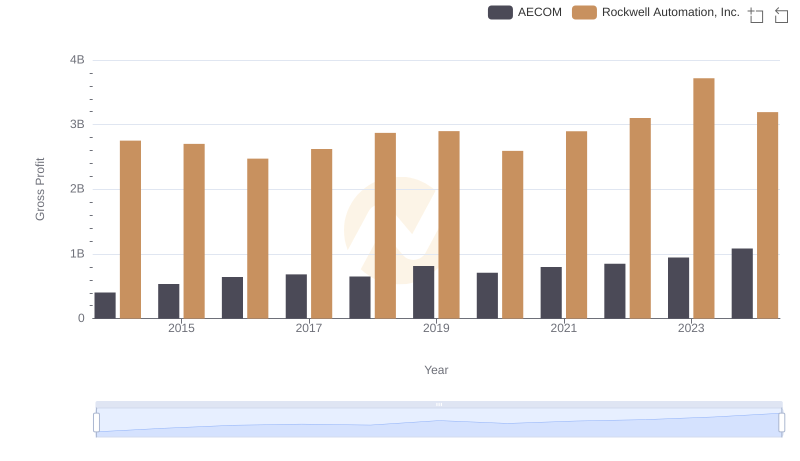
Gross Profit Analysis: Comparing Rockwell Automation, Inc. and AECOM
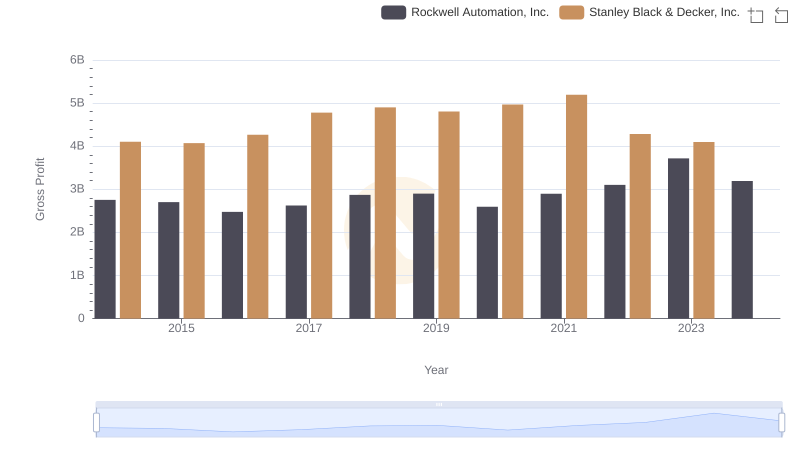
Who Generates Higher Gross Profit? Rockwell Automation, Inc. or Stanley Black & Decker, Inc.
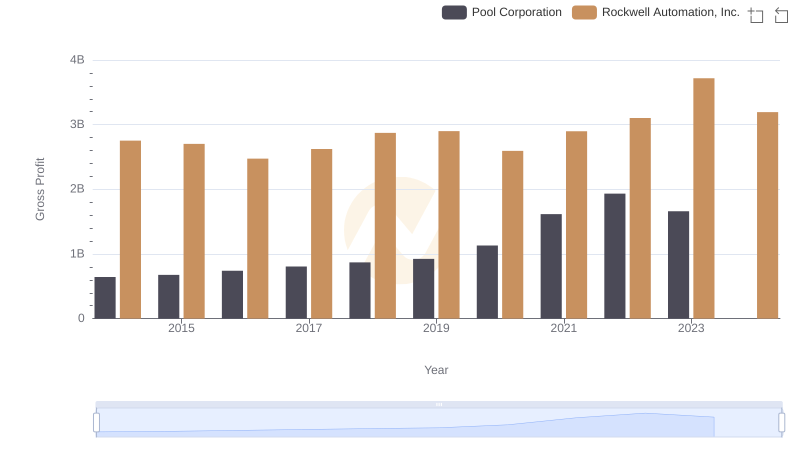
Rockwell Automation, Inc. and Pool Corporation: A Detailed Gross Profit Analysis
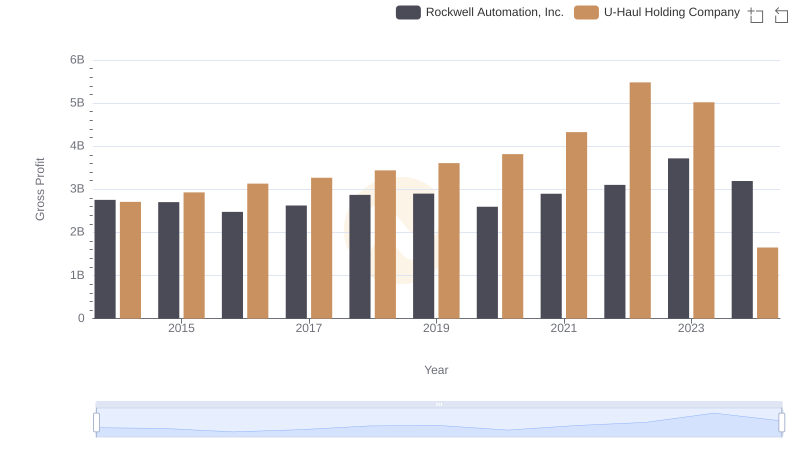
Who Generates Higher Gross Profit? Rockwell Automation, Inc. or U-Haul Holding Company
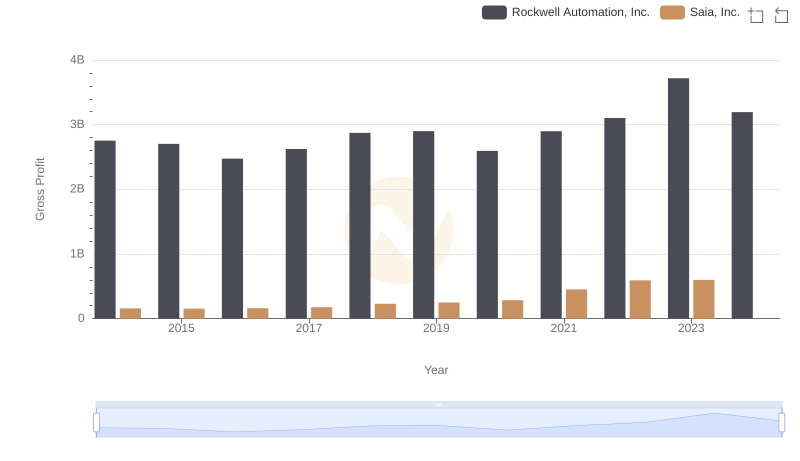
Key Insights on Gross Profit: Rockwell Automation, Inc. vs Saia, Inc.
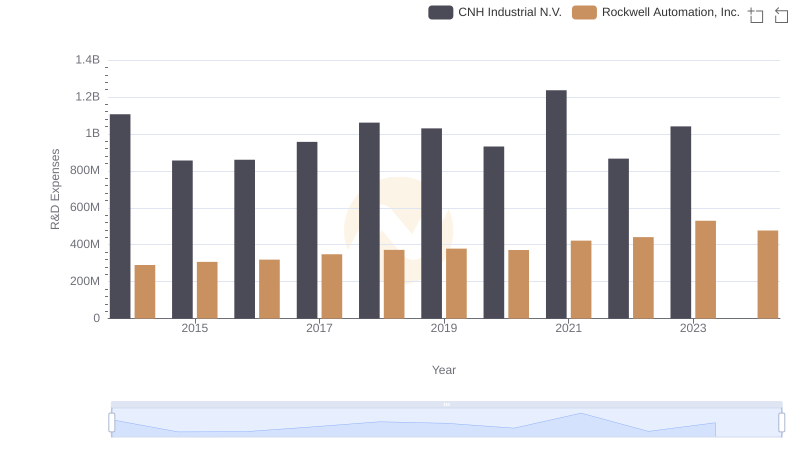
Research and Development Expenses Breakdown: Rockwell Automation, Inc. vs CNH Industrial N.V.
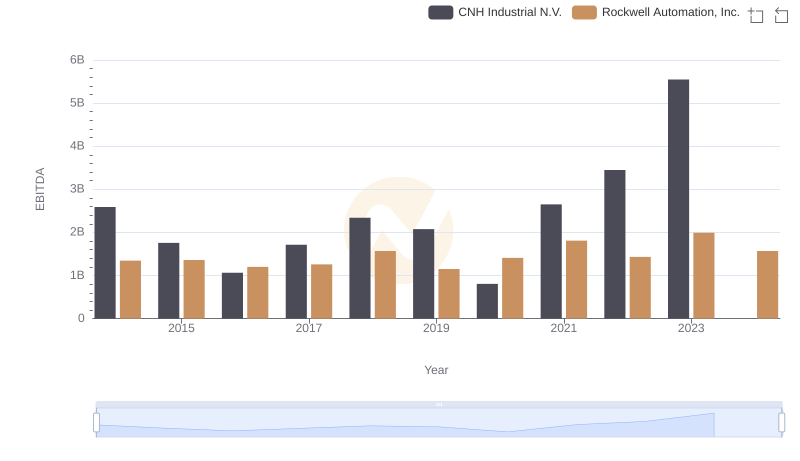
A Side-by-Side Analysis of EBITDA: Rockwell Automation, Inc. and CNH Industrial N.V.