| __timestamp | Comfort Systems USA, Inc. | Rockwell Automation, Inc. |
|---|---|---|
| Wednesday, January 1, 2014 | 1161024000 | 3869600000 |
| Thursday, January 1, 2015 | 1262390000 | 3604800000 |
| Friday, January 1, 2016 | 1290331000 | 3404000000 |
| Sunday, January 1, 2017 | 1421641000 | 3687100000 |
| Monday, January 1, 2018 | 1736600000 | 3793800000 |
| Tuesday, January 1, 2019 | 2113334000 | 3794700000 |
| Wednesday, January 1, 2020 | 2309676000 | 3734600000 |
| Friday, January 1, 2021 | 2510429000 | 4099700000 |
| Saturday, January 1, 2022 | 3398756000 | 4658400000 |
| Sunday, January 1, 2023 | 4216251000 | 5341000000 |
| Monday, January 1, 2024 | 5070800000 |
In pursuit of knowledge
In the ever-evolving landscape of industrial automation and building services, understanding cost dynamics is crucial. Rockwell Automation, Inc. and Comfort Systems USA, Inc. have shown distinct trends in their cost of revenue from 2014 to 2023. Rockwell Automation, a leader in industrial automation, has seen a steady increase in its cost of revenue, peaking at approximately $5.34 billion in 2023, a 38% rise from 2014. Meanwhile, Comfort Systems USA, specializing in mechanical services, experienced a more dramatic surge, with costs rising by 263% over the same period, reaching $4.22 billion in 2023. This stark contrast highlights the differing operational scales and market strategies of these companies. Notably, data for Comfort Systems in 2024 is missing, suggesting potential shifts or reporting changes. Such insights are invaluable for investors and industry analysts aiming to navigate these sectors.
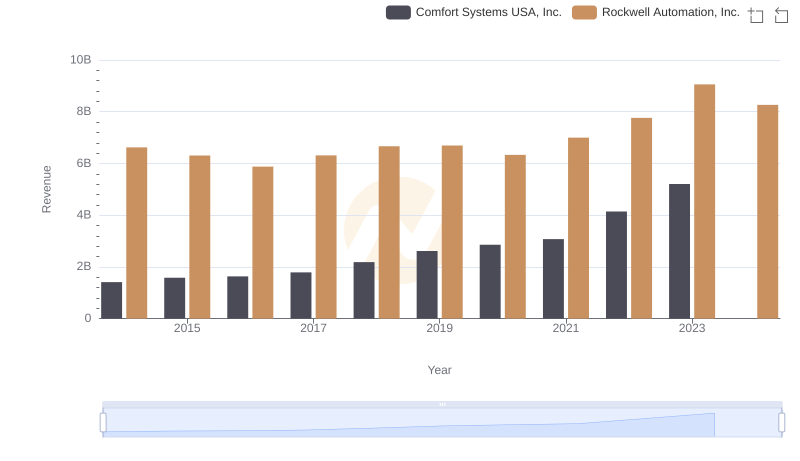
Comparing Revenue Performance: Rockwell Automation, Inc. or Comfort Systems USA, Inc.?
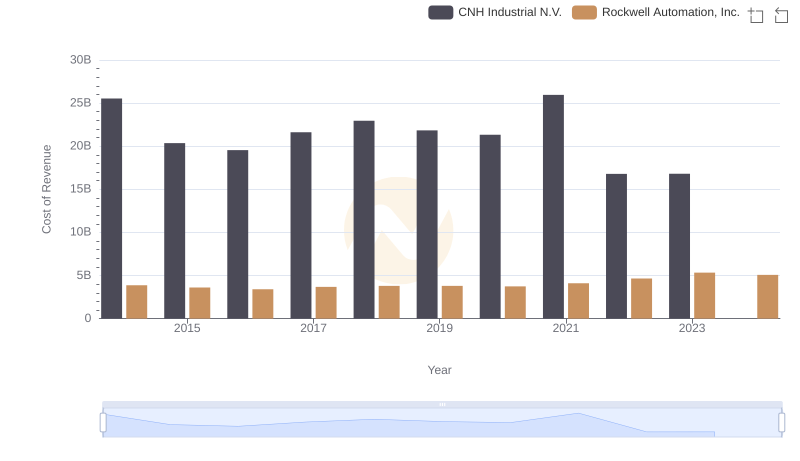
Comparing Cost of Revenue Efficiency: Rockwell Automation, Inc. vs CNH Industrial N.V.
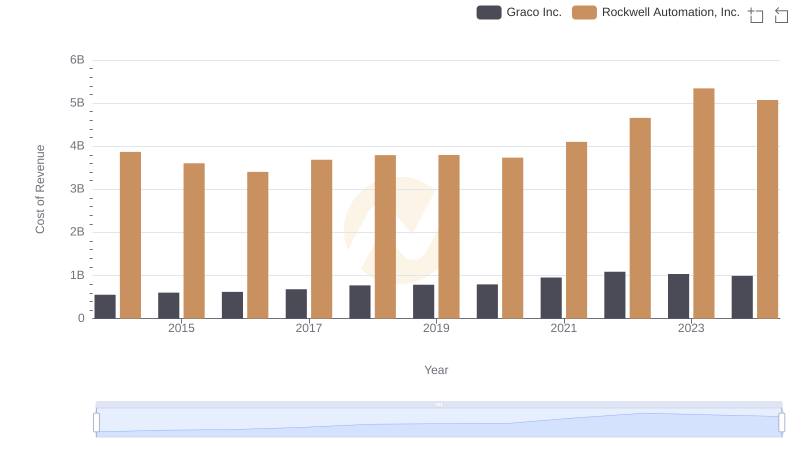
Cost Insights: Breaking Down Rockwell Automation, Inc. and Graco Inc.'s Expenses
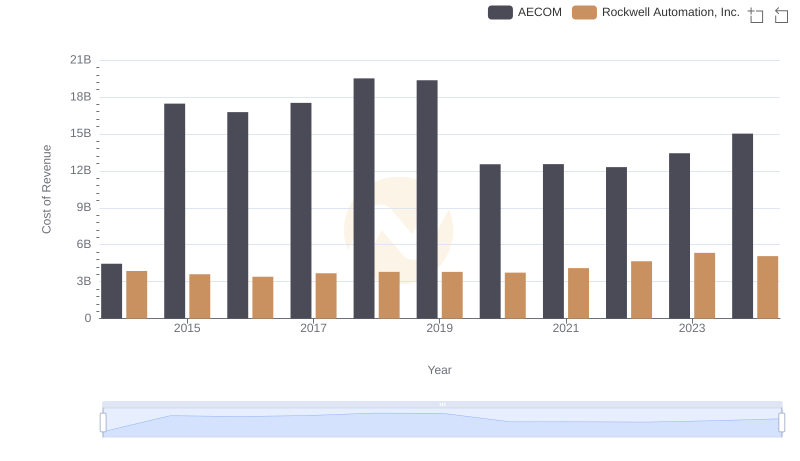
Cost of Revenue: Key Insights for Rockwell Automation, Inc. and AECOM
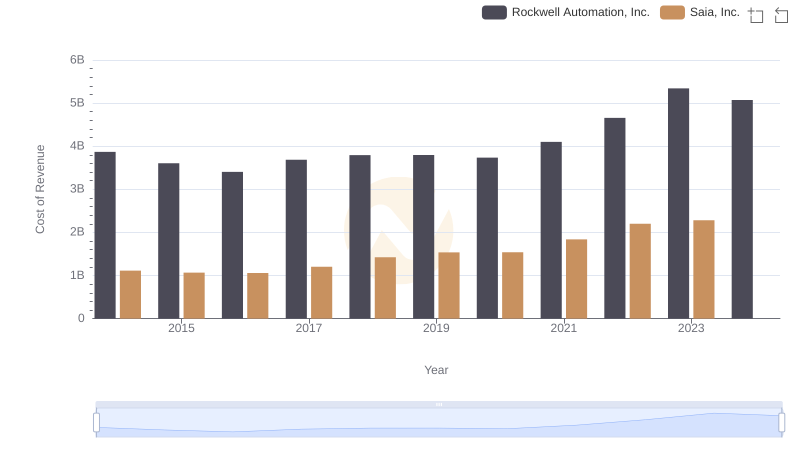
Cost of Revenue Comparison: Rockwell Automation, Inc. vs Saia, Inc.
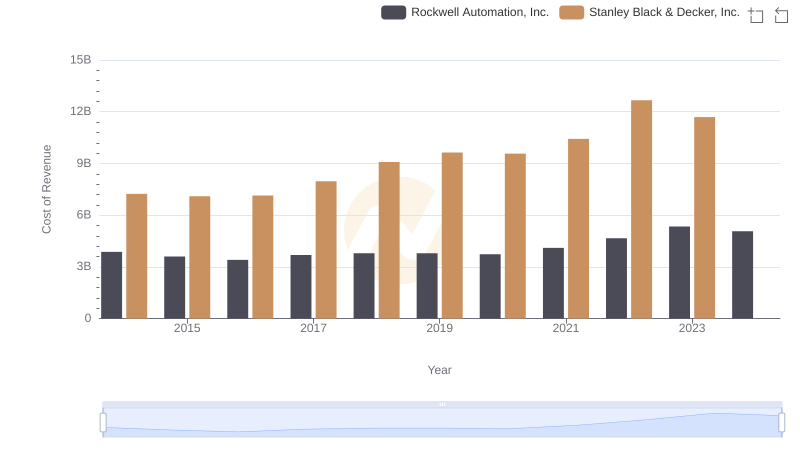
Rockwell Automation, Inc. vs Stanley Black & Decker, Inc.: Efficiency in Cost of Revenue Explored
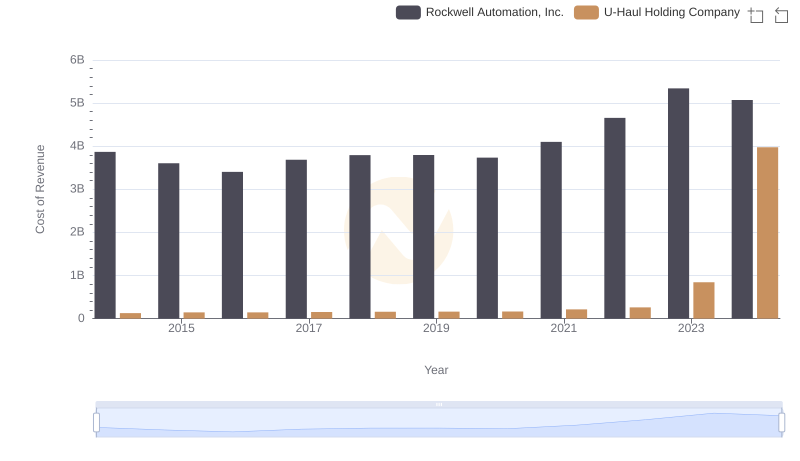
Analyzing Cost of Revenue: Rockwell Automation, Inc. and U-Haul Holding Company
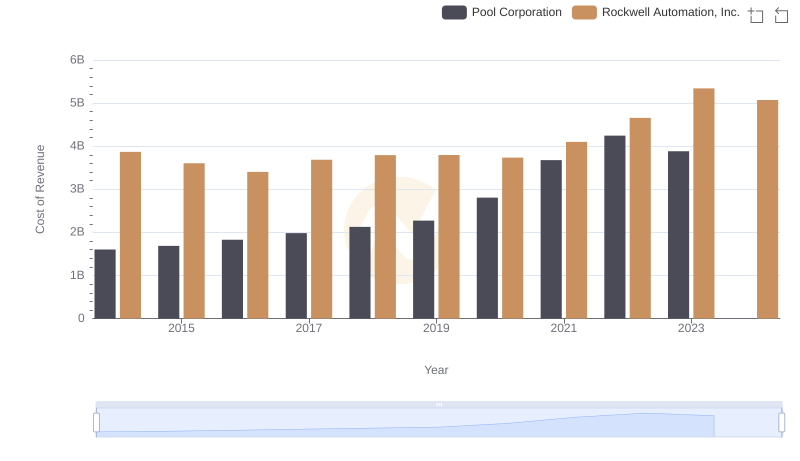
Analyzing Cost of Revenue: Rockwell Automation, Inc. and Pool Corporation
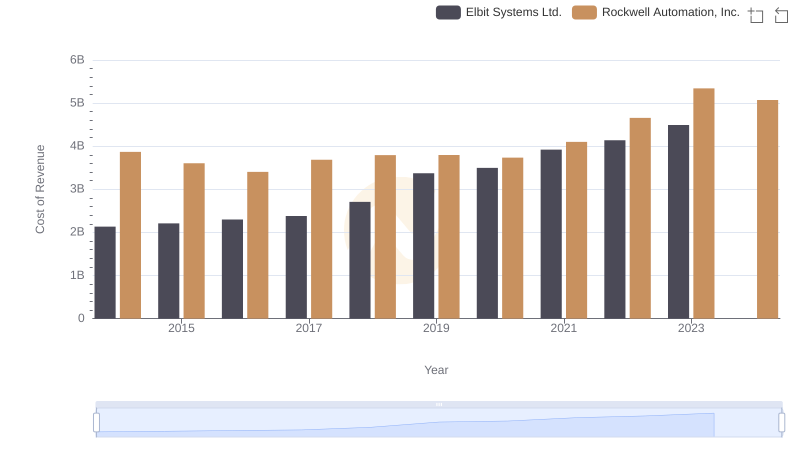
Cost Insights: Breaking Down Rockwell Automation, Inc. and Elbit Systems Ltd.'s Expenses
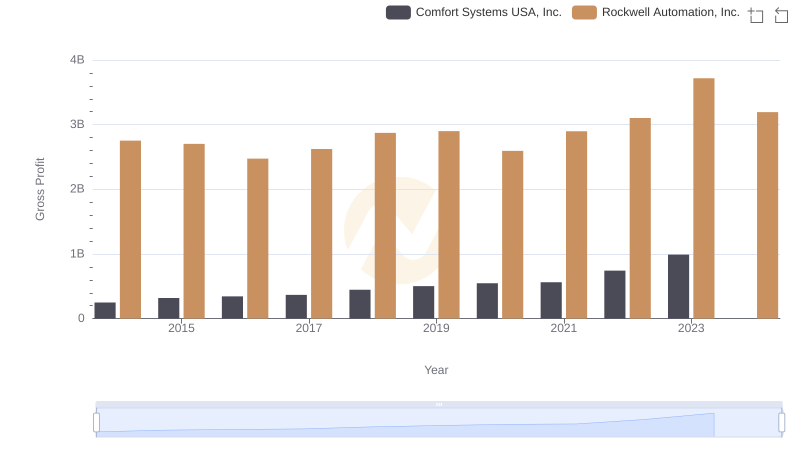
Rockwell Automation, Inc. vs Comfort Systems USA, Inc.: A Gross Profit Performance Breakdown
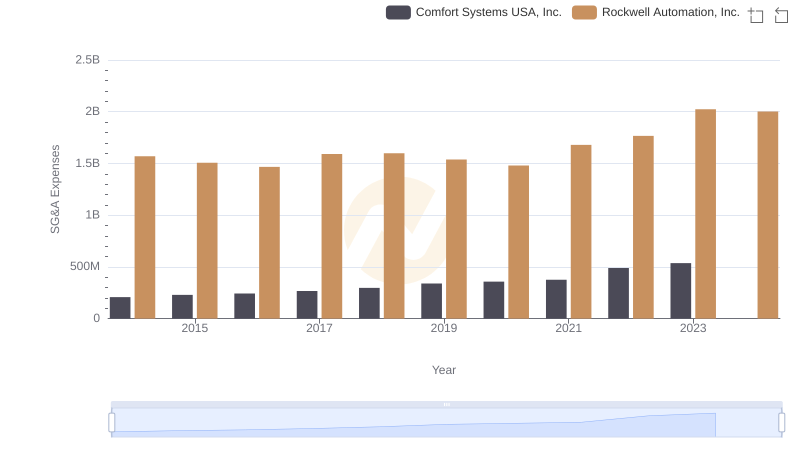
SG&A Efficiency Analysis: Comparing Rockwell Automation, Inc. and Comfort Systems USA, Inc.
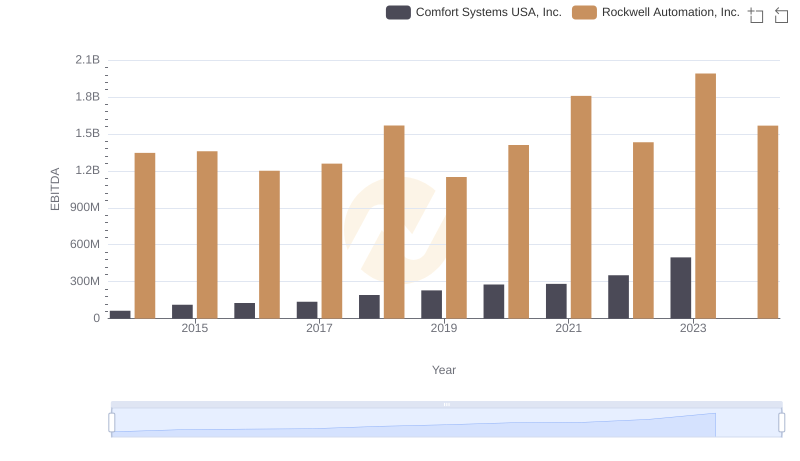
EBITDA Metrics Evaluated: Rockwell Automation, Inc. vs Comfort Systems USA, Inc.