| __timestamp | Comfort Systems USA, Inc. | Rockwell Automation, Inc. |
|---|---|---|
| Wednesday, January 1, 2014 | 207652000 | 1570100000 |
| Thursday, January 1, 2015 | 228965000 | 1506400000 |
| Friday, January 1, 2016 | 243201000 | 1467400000 |
| Sunday, January 1, 2017 | 266586000 | 1591500000 |
| Monday, January 1, 2018 | 296986000 | 1599000000 |
| Tuesday, January 1, 2019 | 340005000 | 1538500000 |
| Wednesday, January 1, 2020 | 357777000 | 1479800000 |
| Friday, January 1, 2021 | 376309000 | 1680000000 |
| Saturday, January 1, 2022 | 489344000 | 1766700000 |
| Sunday, January 1, 2023 | 536188999 | 2023700000 |
| Monday, January 1, 2024 | 2002600000 |
Cracking the code
In the competitive landscape of industrial automation and building services, understanding SG&A (Selling, General, and Administrative) efficiency is crucial. Rockwell Automation, Inc. and Comfort Systems USA, Inc. offer a fascinating comparison over the past decade.
From 2014 to 2023, Rockwell Automation's SG&A expenses have shown a steady increase, peaking at approximately $2 billion in 2023. This represents a growth of about 29% from 2014. Despite the rising costs, Rockwell's strategic investments in automation technology have kept them at the forefront of the industry.
Comfort Systems USA, Inc. has experienced a more dramatic rise in SG&A expenses, with a 158% increase from 2014 to 2023, reaching over $536 million. This surge reflects their aggressive expansion and adaptation to the growing demand for energy-efficient building solutions.
Both companies illustrate different strategies in managing SG&A expenses, highlighting the diverse approaches to achieving operational efficiency in their respective sectors.
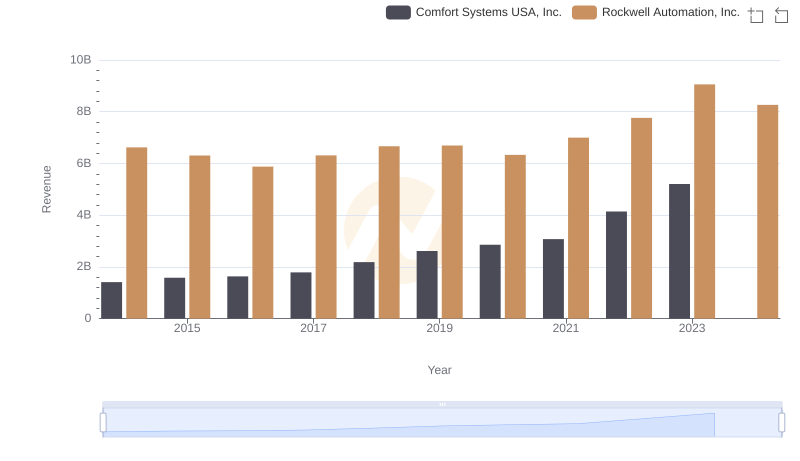
Comparing Revenue Performance: Rockwell Automation, Inc. or Comfort Systems USA, Inc.?
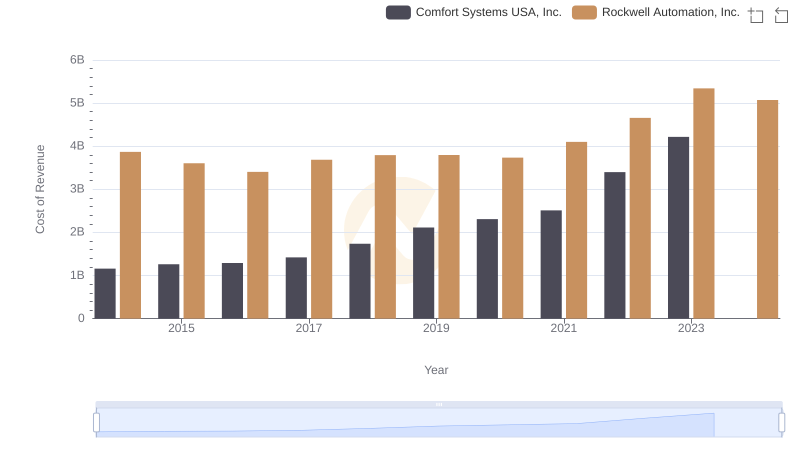
Cost of Revenue: Key Insights for Rockwell Automation, Inc. and Comfort Systems USA, Inc.
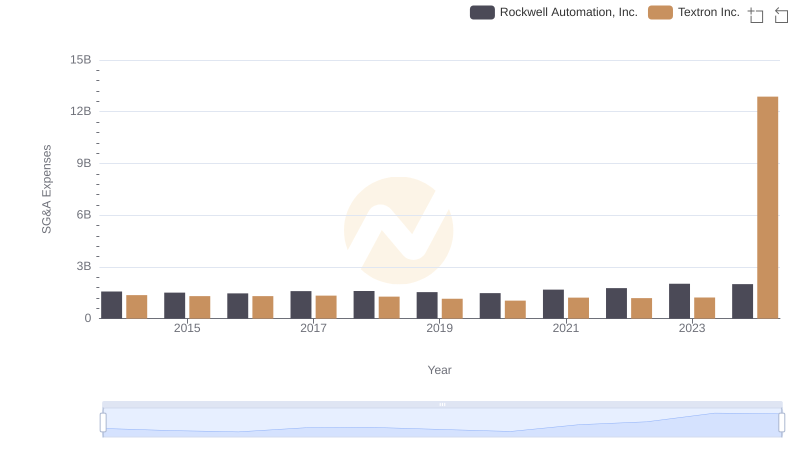
Rockwell Automation, Inc. vs Textron Inc.: SG&A Expense Trends
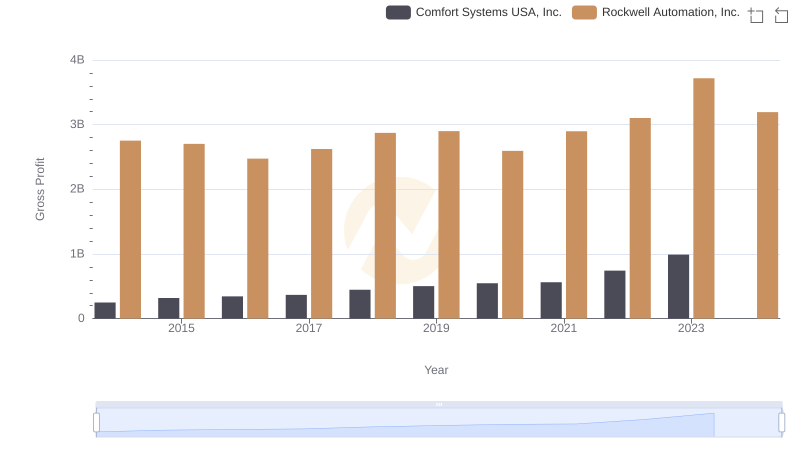
Rockwell Automation, Inc. vs Comfort Systems USA, Inc.: A Gross Profit Performance Breakdown
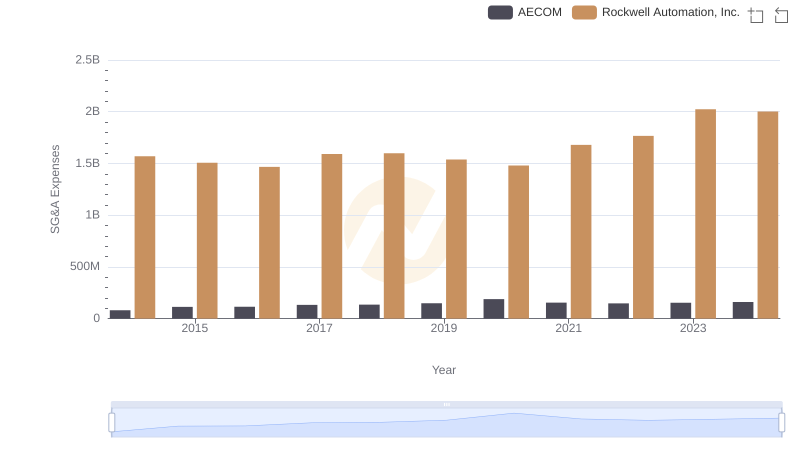
SG&A Efficiency Analysis: Comparing Rockwell Automation, Inc. and AECOM

SG&A Efficiency Analysis: Comparing Rockwell Automation, Inc. and U-Haul Holding Company

Comparing SG&A Expenses: Rockwell Automation, Inc. vs Pool Corporation Trends and Insights
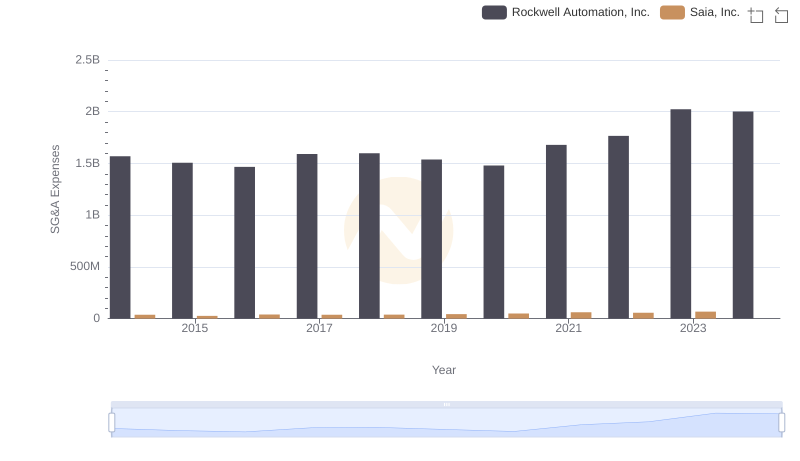
Comparing SG&A Expenses: Rockwell Automation, Inc. vs Saia, Inc. Trends and Insights
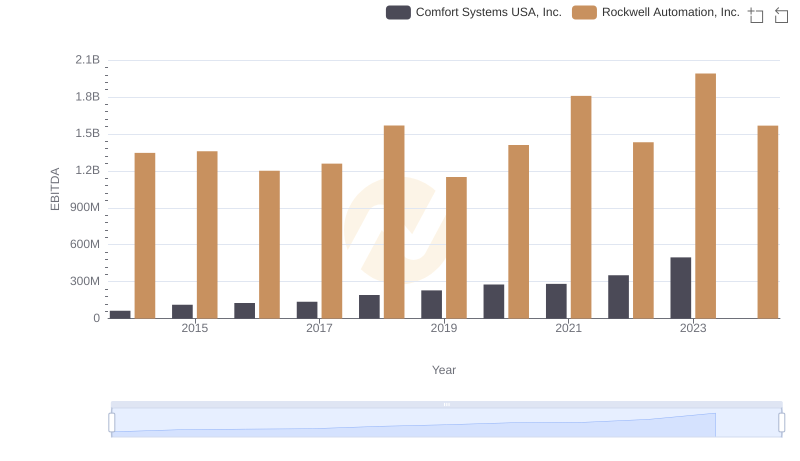
EBITDA Metrics Evaluated: Rockwell Automation, Inc. vs Comfort Systems USA, Inc.

Who Optimizes SG&A Costs Better? Rockwell Automation, Inc. or Stanley Black & Decker, Inc.