| __timestamp | Pool Corporation | Rockwell Automation, Inc. |
|---|---|---|
| Wednesday, January 1, 2014 | 643340000 | 2753900000 |
| Thursday, January 1, 2015 | 675644000 | 2703100000 |
| Friday, January 1, 2016 | 741087000 | 2475500000 |
| Sunday, January 1, 2017 | 805289000 | 2624200000 |
| Monday, January 1, 2018 | 870173000 | 2872200000 |
| Tuesday, January 1, 2019 | 924925000 | 2900100000 |
| Wednesday, January 1, 2020 | 1130902000 | 2595200000 |
| Friday, January 1, 2021 | 1617092000 | 2897700000 |
| Saturday, January 1, 2022 | 1933412000 | 3102000000 |
| Sunday, January 1, 2023 | 1660044000 | 3717000000 |
| Monday, January 1, 2024 | 3193400000 |
Unveiling the hidden dimensions of data
In the ever-evolving landscape of industrial automation and pool supplies, Rockwell Automation and Pool Corporation have carved out significant niches. Over the past decade, Rockwell Automation has consistently outperformed Pool Corporation in terms of gross profit, boasting an average of $2.9 billion annually. In contrast, Pool Corporation has shown impressive growth, with its gross profit increasing by over 150% from 2014 to 2023.
This analysis highlights the resilience and growth potential of these industry leaders, even amidst economic uncertainties.
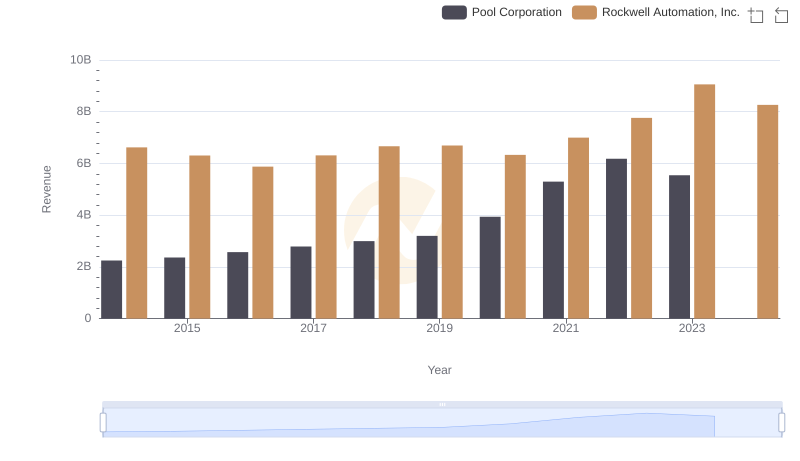
Annual Revenue Comparison: Rockwell Automation, Inc. vs Pool Corporation
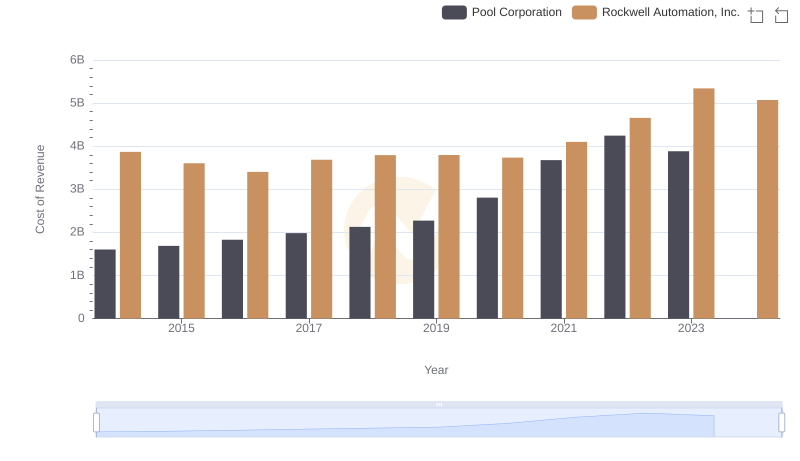
Analyzing Cost of Revenue: Rockwell Automation, Inc. and Pool Corporation
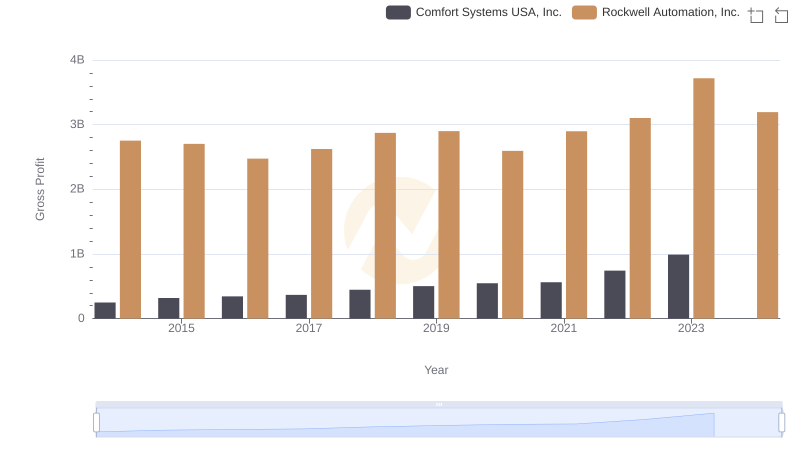
Rockwell Automation, Inc. vs Comfort Systems USA, Inc.: A Gross Profit Performance Breakdown
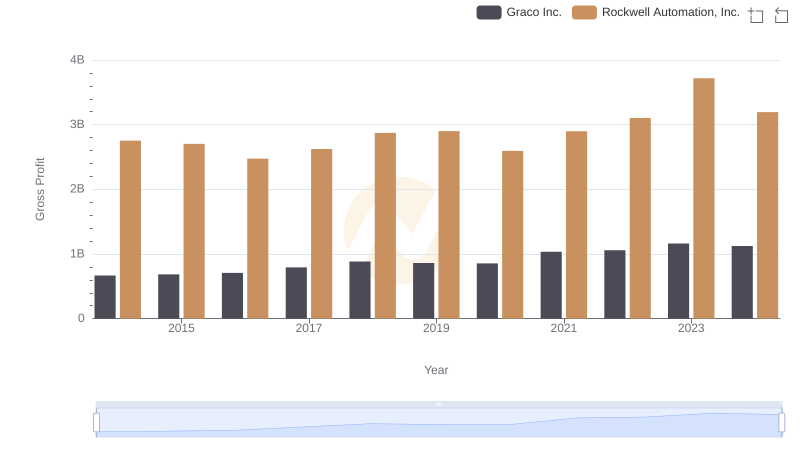
Gross Profit Trends Compared: Rockwell Automation, Inc. vs Graco Inc.
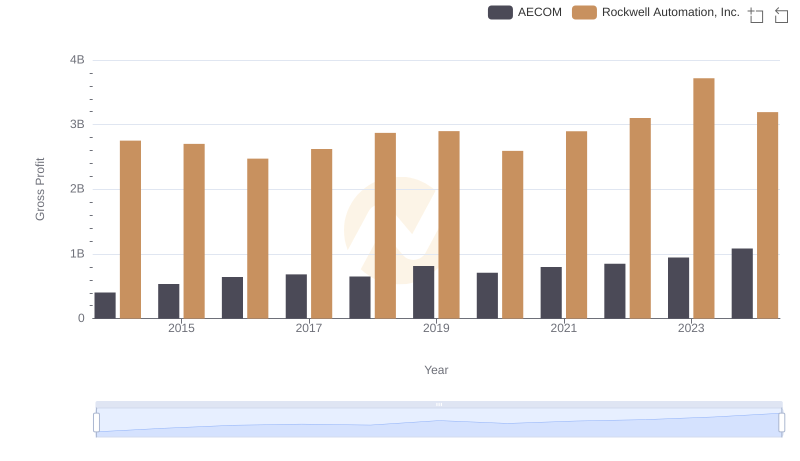
Gross Profit Analysis: Comparing Rockwell Automation, Inc. and AECOM
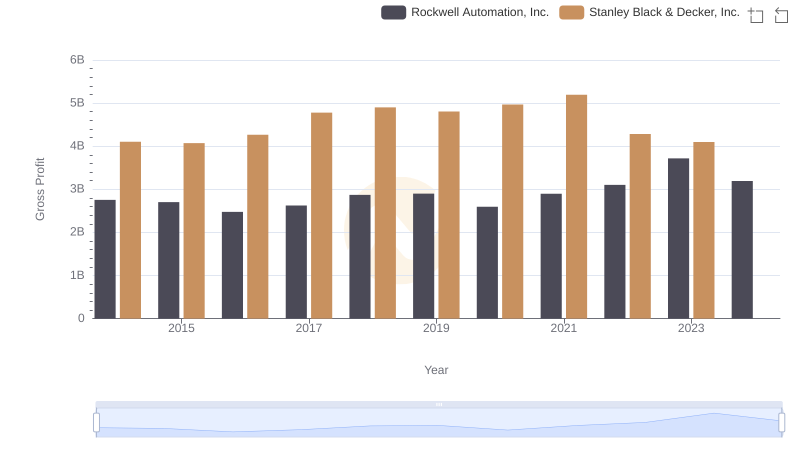
Who Generates Higher Gross Profit? Rockwell Automation, Inc. or Stanley Black & Decker, Inc.
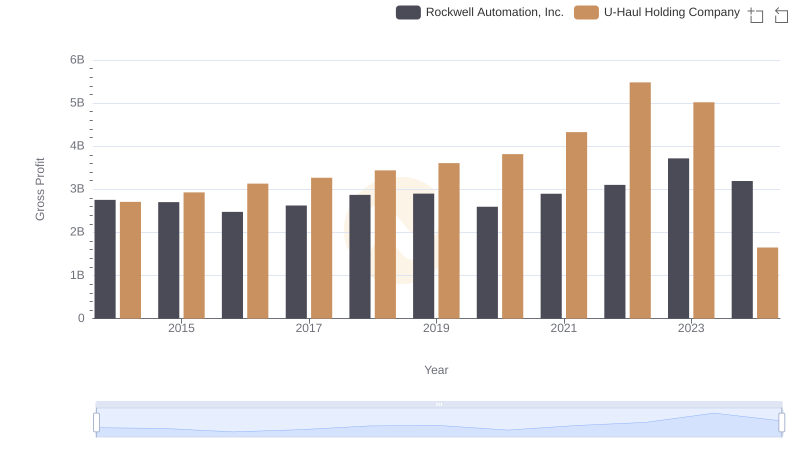
Who Generates Higher Gross Profit? Rockwell Automation, Inc. or U-Haul Holding Company
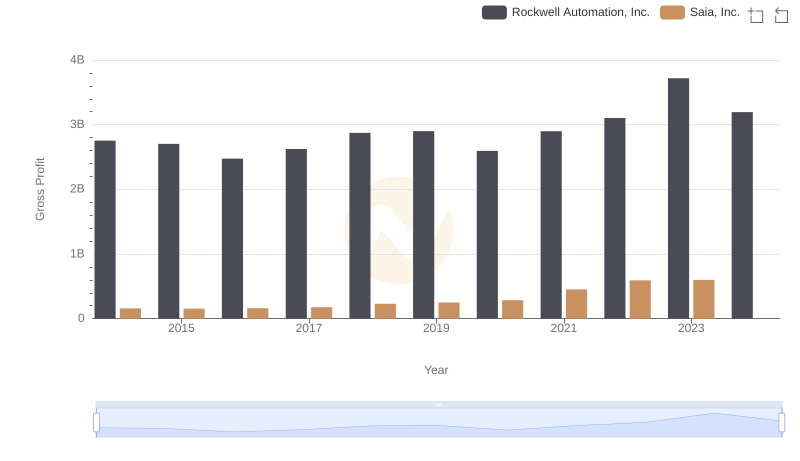
Key Insights on Gross Profit: Rockwell Automation, Inc. vs Saia, Inc.
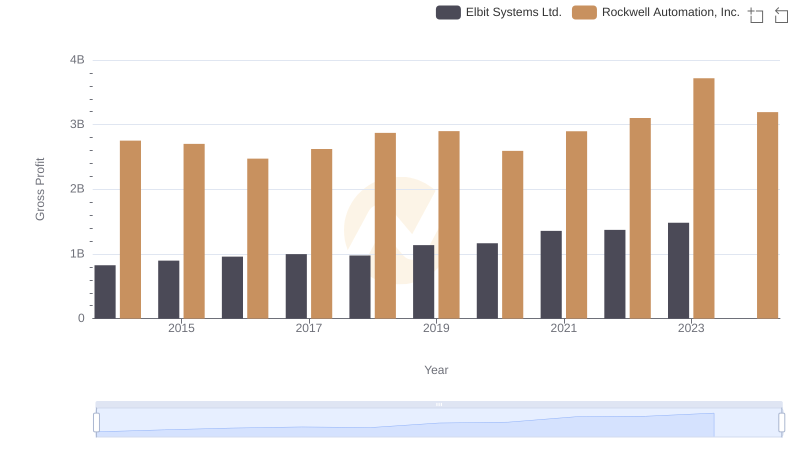
Rockwell Automation, Inc. vs Elbit Systems Ltd.: A Gross Profit Performance Breakdown
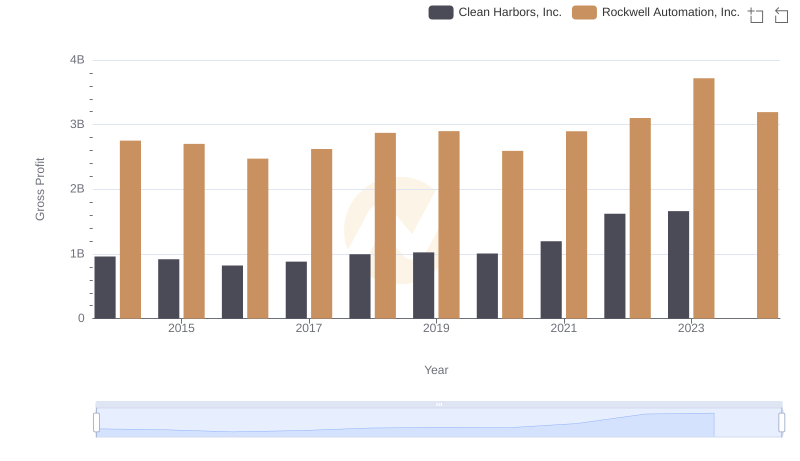
Rockwell Automation, Inc. vs Clean Harbors, Inc.: A Gross Profit Performance Breakdown

Comparing SG&A Expenses: Rockwell Automation, Inc. vs Pool Corporation Trends and Insights