| __timestamp | AECOM | Rockwell Automation, Inc. |
|---|---|---|
| Wednesday, January 1, 2014 | 403176000 | 2753900000 |
| Thursday, January 1, 2015 | 535188000 | 2703100000 |
| Friday, January 1, 2016 | 642824000 | 2475500000 |
| Sunday, January 1, 2017 | 683720000 | 2624200000 |
| Monday, January 1, 2018 | 650649000 | 2872200000 |
| Tuesday, January 1, 2019 | 813445000 | 2900100000 |
| Wednesday, January 1, 2020 | 709560000 | 2595200000 |
| Friday, January 1, 2021 | 798421000 | 2897700000 |
| Saturday, January 1, 2022 | 847974000 | 3102000000 |
| Sunday, January 1, 2023 | 945465000 | 3717000000 |
| Monday, January 1, 2024 | 1084341000 | 3193400000 |
Unleashing the power of data
In the competitive landscape of industrial automation and infrastructure services, Rockwell Automation, Inc. and AECOM have showcased distinct trajectories in their gross profit margins over the past decade. From 2014 to 2024, Rockwell Automation consistently outperformed AECOM, with its gross profit peaking at approximately 3.7 billion in 2023, marking a 35% increase from its lowest point in 2016. Meanwhile, AECOM demonstrated a steady growth, achieving a remarkable 169% increase in gross profit from 2014 to 2024, reaching over 1 billion. This growth reflects AECOM's strategic expansions and operational efficiencies. The data highlights the resilience and adaptability of these industry leaders, with Rockwell Automation maintaining a robust lead, while AECOM's impressive growth trajectory signals its rising prominence in the sector. As we look to the future, these trends offer valuable insights into the evolving dynamics of the industrial and infrastructure sectors.
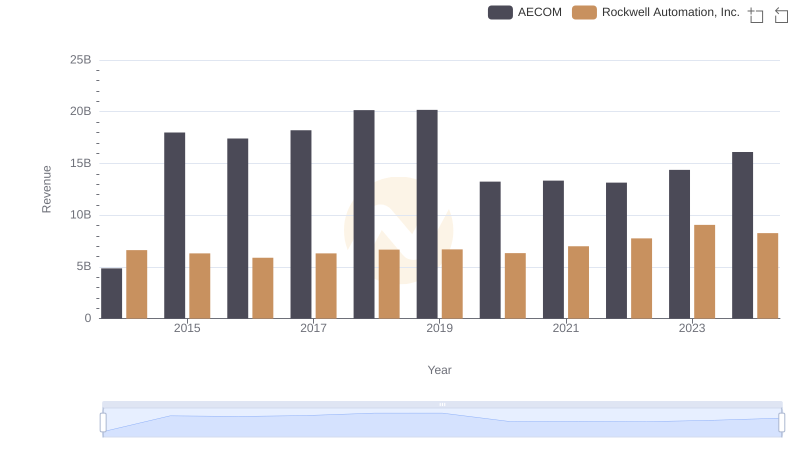
Breaking Down Revenue Trends: Rockwell Automation, Inc. vs AECOM
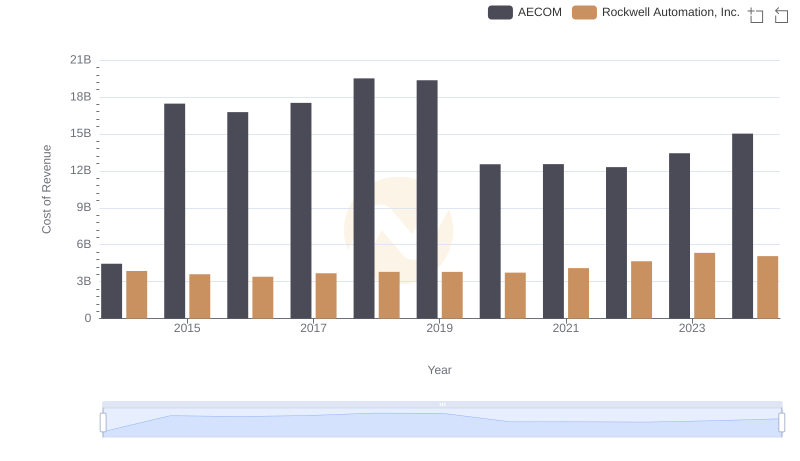
Cost of Revenue: Key Insights for Rockwell Automation, Inc. and AECOM
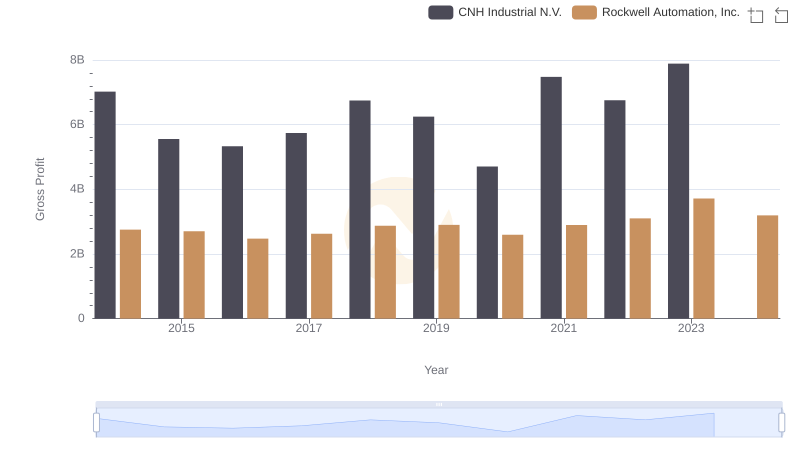
Rockwell Automation, Inc. and CNH Industrial N.V.: A Detailed Gross Profit Analysis
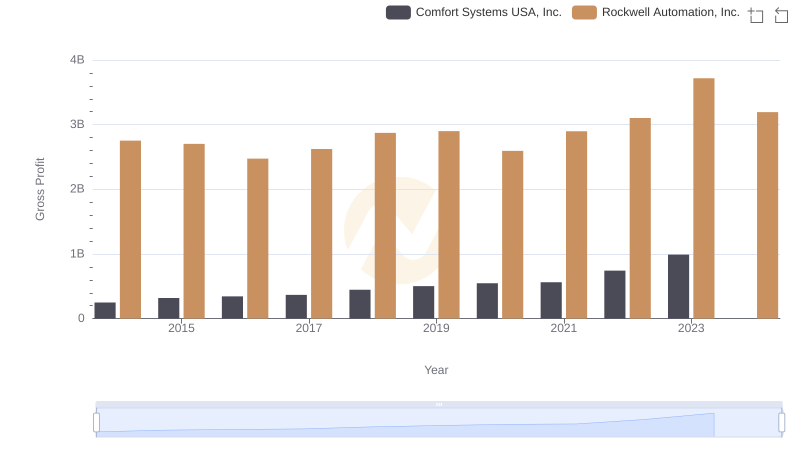
Rockwell Automation, Inc. vs Comfort Systems USA, Inc.: A Gross Profit Performance Breakdown
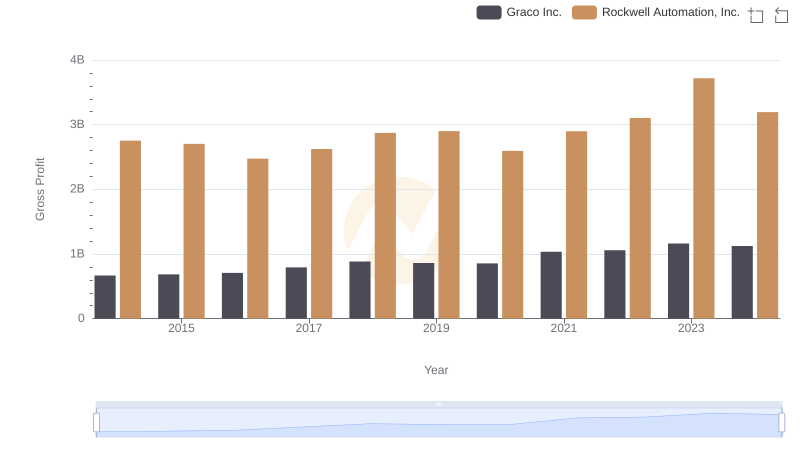
Gross Profit Trends Compared: Rockwell Automation, Inc. vs Graco Inc.
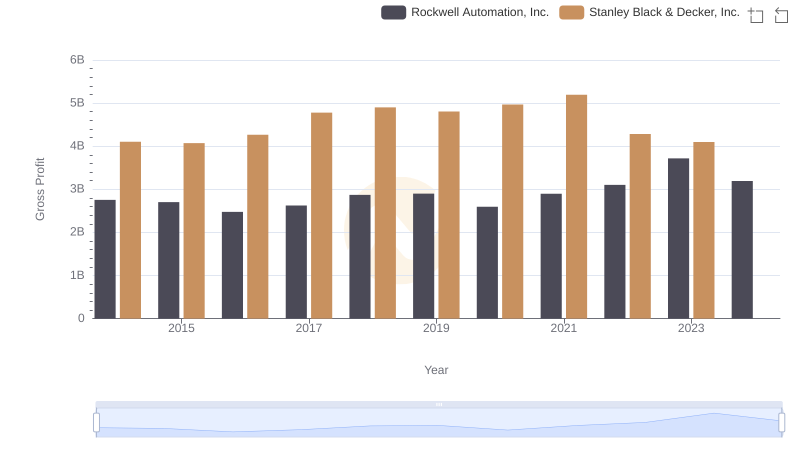
Who Generates Higher Gross Profit? Rockwell Automation, Inc. or Stanley Black & Decker, Inc.
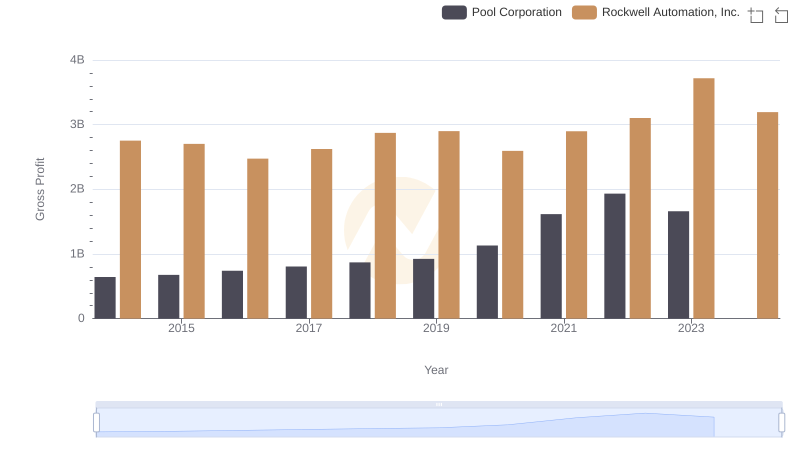
Rockwell Automation, Inc. and Pool Corporation: A Detailed Gross Profit Analysis
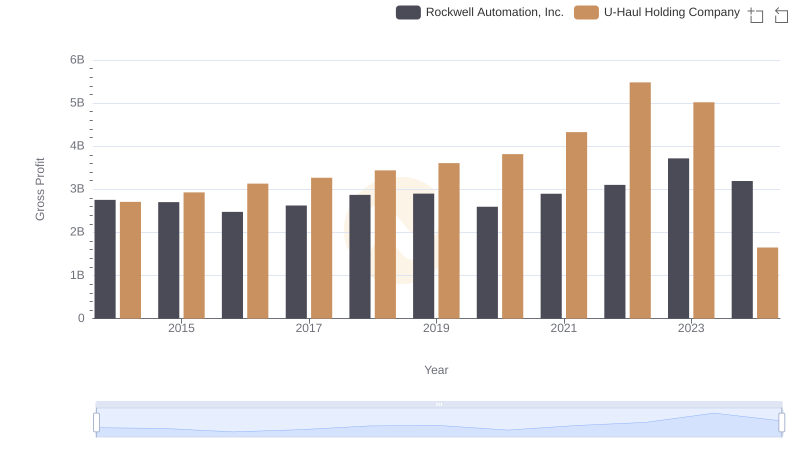
Who Generates Higher Gross Profit? Rockwell Automation, Inc. or U-Haul Holding Company
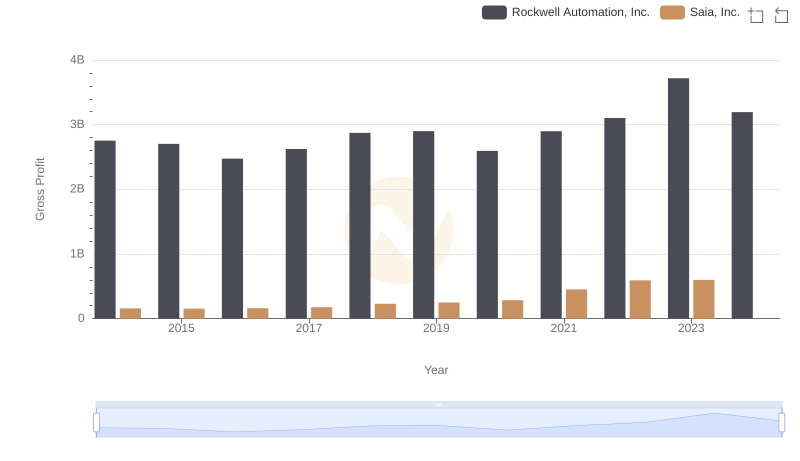
Key Insights on Gross Profit: Rockwell Automation, Inc. vs Saia, Inc.
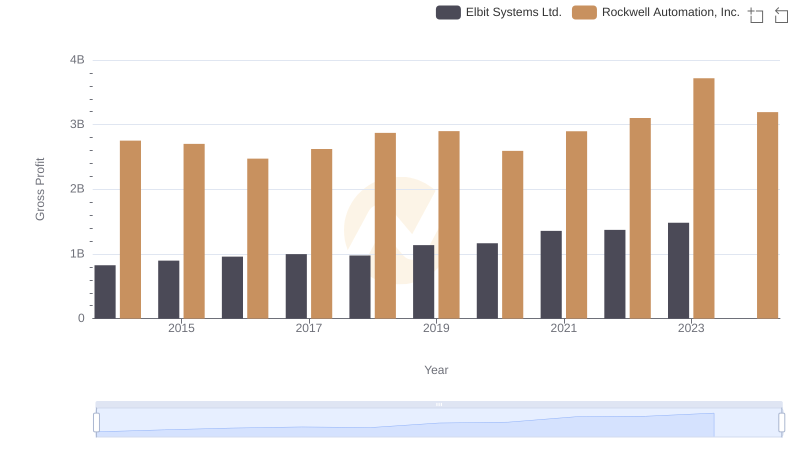
Rockwell Automation, Inc. vs Elbit Systems Ltd.: A Gross Profit Performance Breakdown
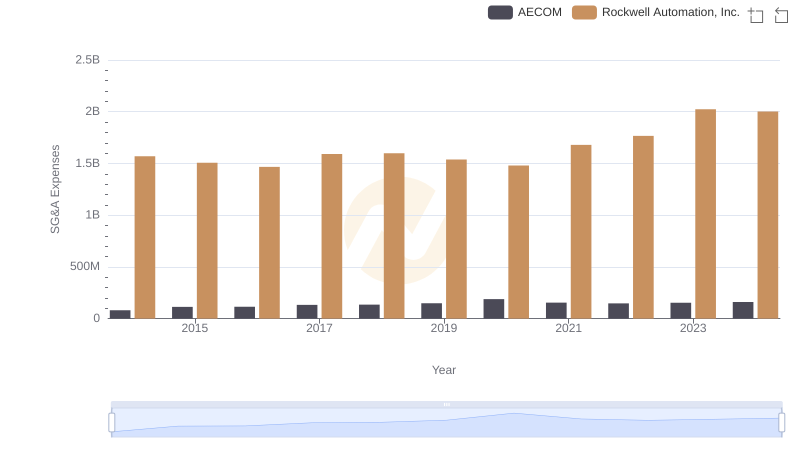
SG&A Efficiency Analysis: Comparing Rockwell Automation, Inc. and AECOM

Comparative EBITDA Analysis: Rockwell Automation, Inc. vs AECOM