| __timestamp | Clean Harbors, Inc. | Rockwell Automation, Inc. |
|---|---|---|
| Wednesday, January 1, 2014 | 959840000 | 2753900000 |
| Thursday, January 1, 2015 | 918331000 | 2703100000 |
| Friday, January 1, 2016 | 822369000 | 2475500000 |
| Sunday, January 1, 2017 | 882305000 | 2624200000 |
| Monday, January 1, 2018 | 994752000 | 2872200000 |
| Tuesday, January 1, 2019 | 1024371000 | 2900100000 |
| Wednesday, January 1, 2020 | 1006346000 | 2595200000 |
| Friday, January 1, 2021 | 1195729000 | 2897700000 |
| Saturday, January 1, 2022 | 1622675000 | 3102000000 |
| Sunday, January 1, 2023 | 1663028000 | 3717000000 |
| Monday, January 1, 2024 | 1824239000 | 3193400000 |
Unleashing the power of data
In the ever-evolving landscape of industrial automation and environmental services, Rockwell Automation, Inc. and Clean Harbors, Inc. have showcased distinct trajectories in gross profit over the past decade. From 2014 to 2023, Rockwell Automation consistently outperformed Clean Harbors, with its gross profit peaking at approximately $3.7 billion in 2023, marking a 35% increase from 2014. In contrast, Clean Harbors experienced a more modest growth, with its gross profit rising by about 73% over the same period, reaching $1.66 billion in 2023.
While Rockwell Automation's growth was steady, Clean Harbors saw a significant surge post-2020, reflecting its strategic adaptations in the environmental sector. Notably, 2024 data for Clean Harbors remains unavailable, leaving room for speculation on its future performance. This analysis underscores the dynamic nature of these industries and the strategic maneuvers companies must employ to thrive.
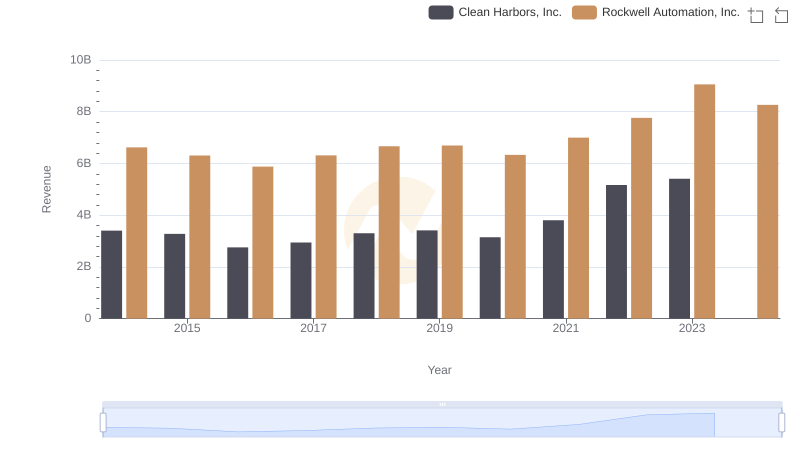
Comparing Revenue Performance: Rockwell Automation, Inc. or Clean Harbors, Inc.?
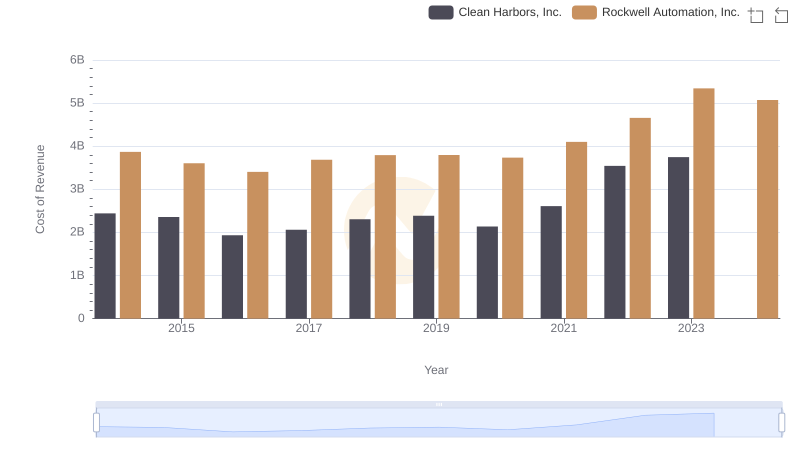
Comparing Cost of Revenue Efficiency: Rockwell Automation, Inc. vs Clean Harbors, Inc.
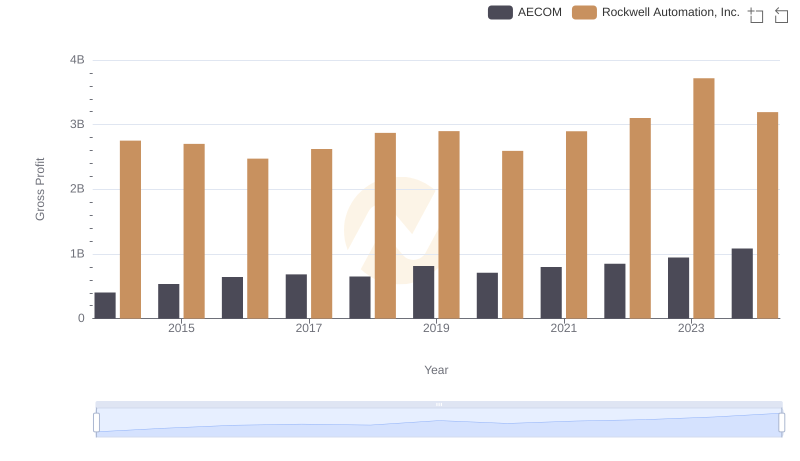
Gross Profit Analysis: Comparing Rockwell Automation, Inc. and AECOM
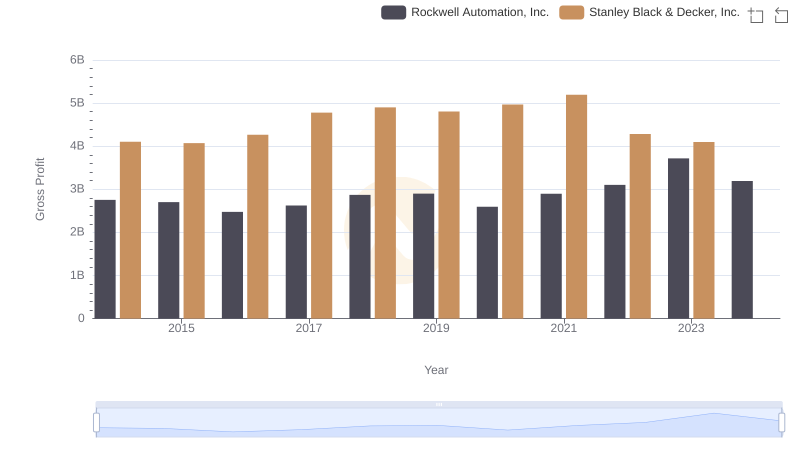
Who Generates Higher Gross Profit? Rockwell Automation, Inc. or Stanley Black & Decker, Inc.
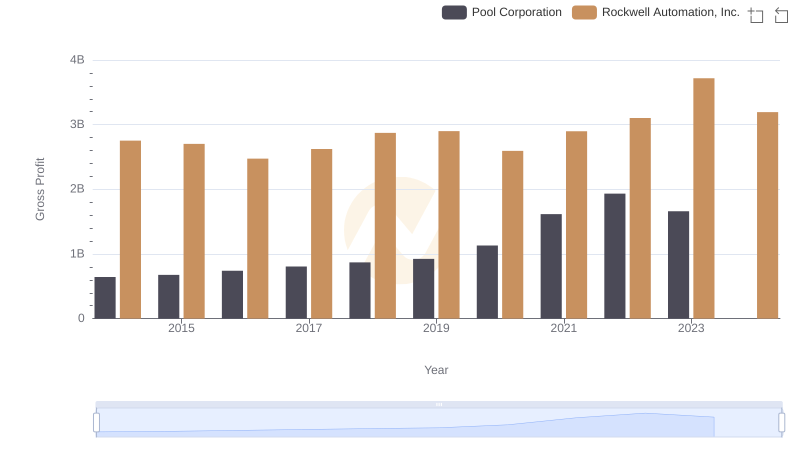
Rockwell Automation, Inc. and Pool Corporation: A Detailed Gross Profit Analysis
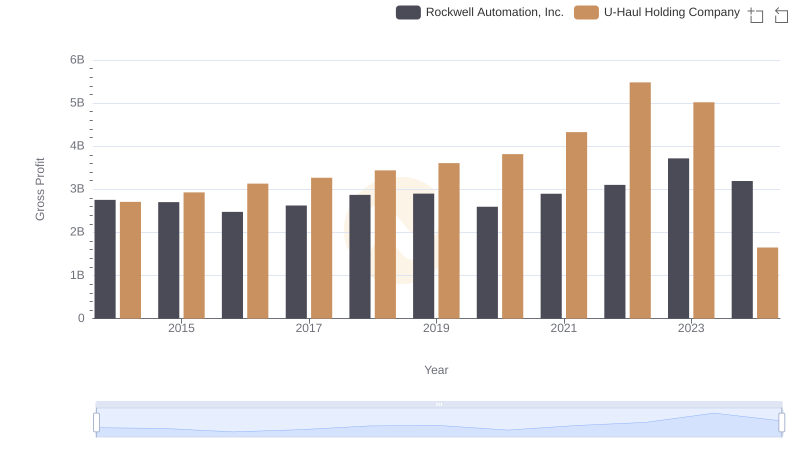
Who Generates Higher Gross Profit? Rockwell Automation, Inc. or U-Haul Holding Company
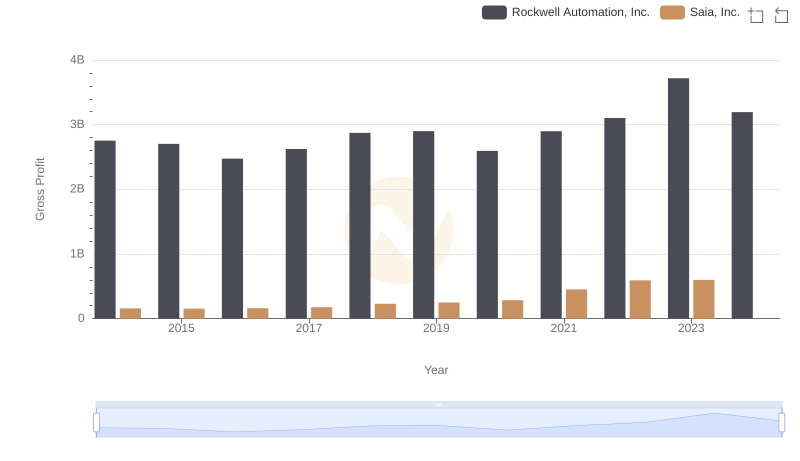
Key Insights on Gross Profit: Rockwell Automation, Inc. vs Saia, Inc.
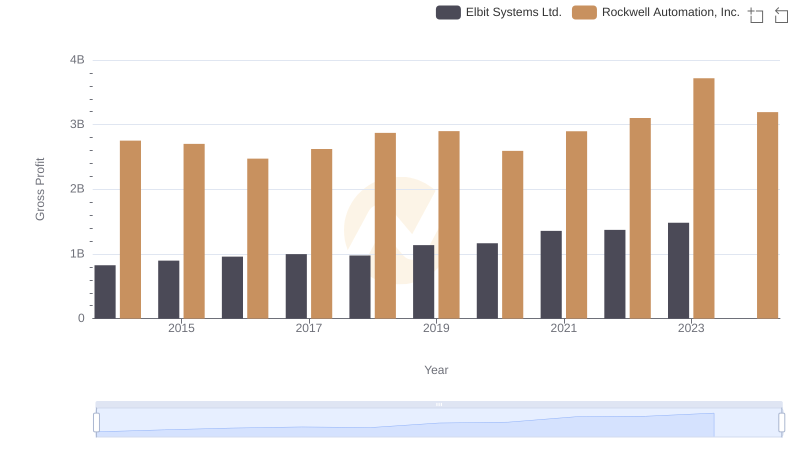
Rockwell Automation, Inc. vs Elbit Systems Ltd.: A Gross Profit Performance Breakdown
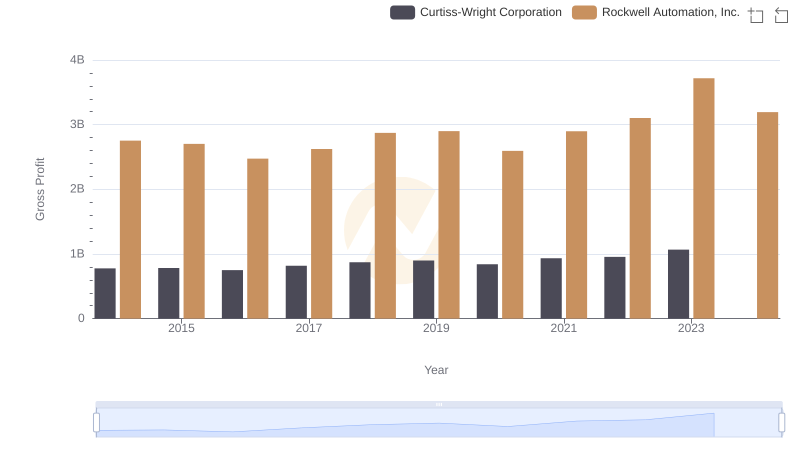
Rockwell Automation, Inc. and Curtiss-Wright Corporation: A Detailed Gross Profit Analysis
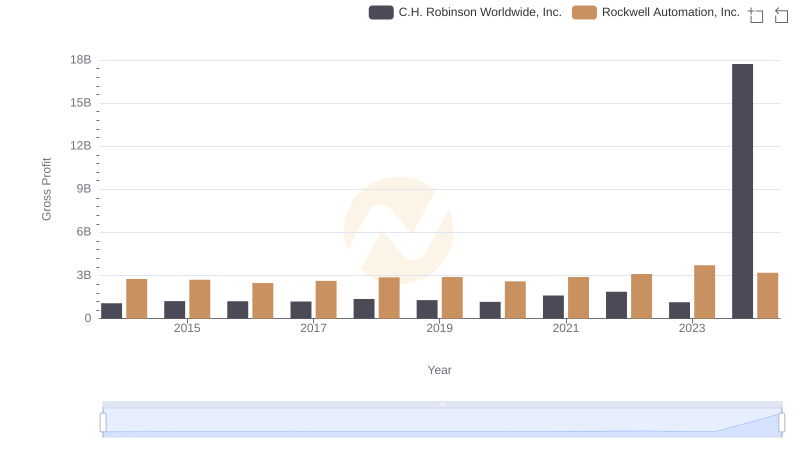
Key Insights on Gross Profit: Rockwell Automation, Inc. vs C.H. Robinson Worldwide, Inc.