| __timestamp | Pool Corporation | Rockwell Automation, Inc. |
|---|---|---|
| Wednesday, January 1, 2014 | 1603222000 | 3869600000 |
| Thursday, January 1, 2015 | 1687495000 | 3604800000 |
| Friday, January 1, 2016 | 1829716000 | 3404000000 |
| Sunday, January 1, 2017 | 1982899000 | 3687100000 |
| Monday, January 1, 2018 | 2127924000 | 3793800000 |
| Tuesday, January 1, 2019 | 2274592000 | 3794700000 |
| Wednesday, January 1, 2020 | 2805721000 | 3734600000 |
| Friday, January 1, 2021 | 3678492000 | 4099700000 |
| Saturday, January 1, 2022 | 4246315000 | 4658400000 |
| Sunday, January 1, 2023 | 3881551000 | 5341000000 |
| Monday, January 1, 2024 | 5070800000 |
Unleashing insights
In the ever-evolving landscape of industrial automation and pool supplies, Rockwell Automation, Inc. and Pool Corporation stand as titans. Over the past decade, these companies have showcased remarkable growth in their cost of revenue, a key indicator of operational scale and efficiency.
From 2014 to 2023, Rockwell Automation's cost of revenue has seen a steady increase, peaking in 2023 with a 38% rise from its 2014 figures. This growth reflects the company's strategic investments in automation technologies and its ability to adapt to market demands.
Pool Corporation, on the other hand, experienced a staggering 165% increase in its cost of revenue from 2014 to 2022, before a slight dip in 2023. This surge underscores the booming demand for pool supplies and services, driven by lifestyle changes and increased home investments.
While the data for 2024 is incomplete, the trends observed provide valuable insights into the operational dynamics of these industry leaders.
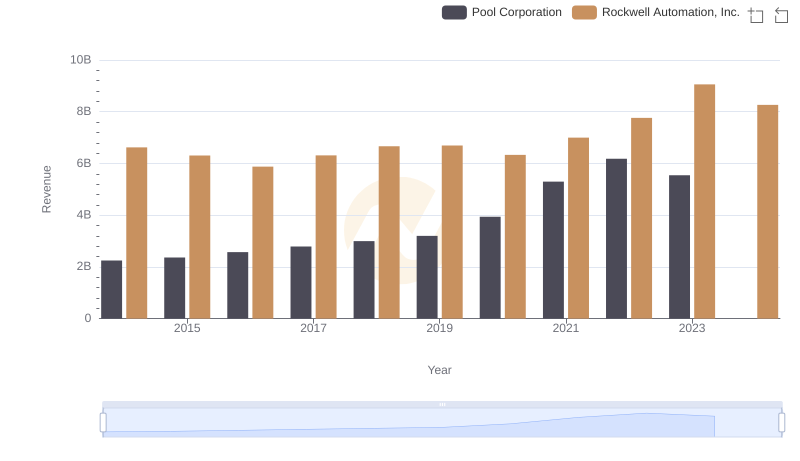
Annual Revenue Comparison: Rockwell Automation, Inc. vs Pool Corporation
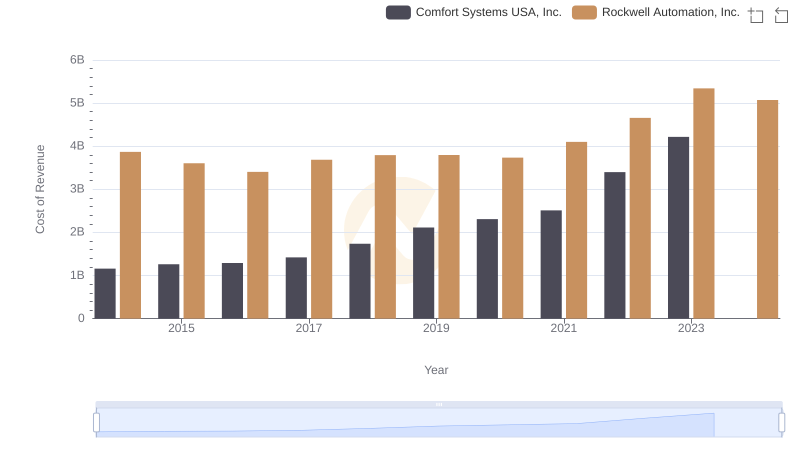
Cost of Revenue: Key Insights for Rockwell Automation, Inc. and Comfort Systems USA, Inc.
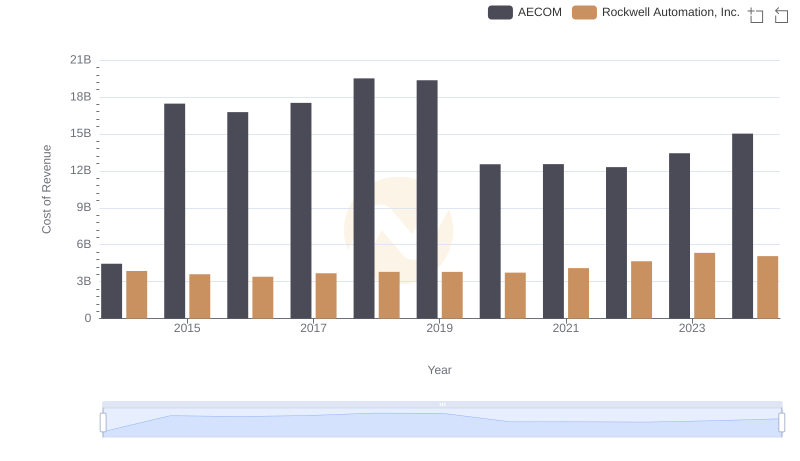
Cost of Revenue: Key Insights for Rockwell Automation, Inc. and AECOM
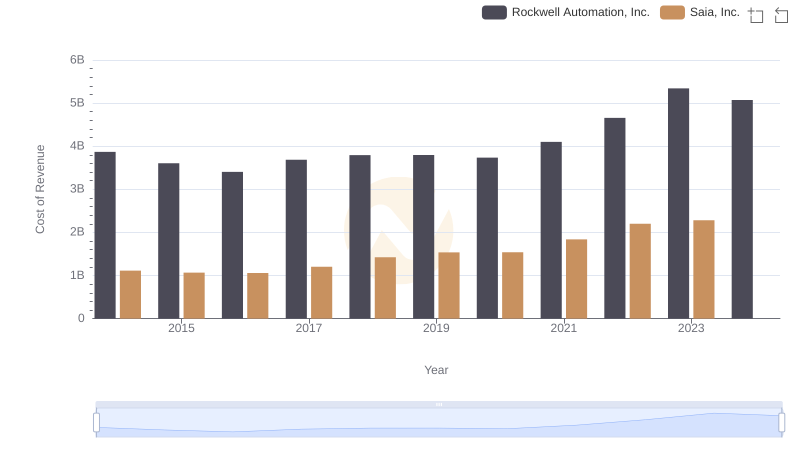
Cost of Revenue Comparison: Rockwell Automation, Inc. vs Saia, Inc.
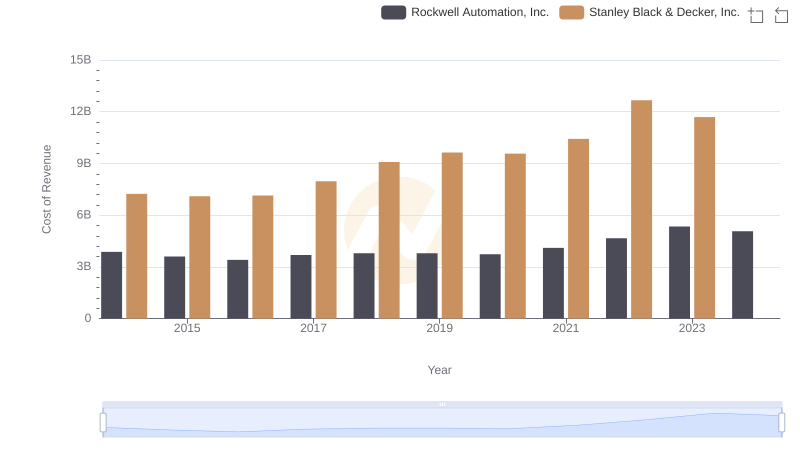
Rockwell Automation, Inc. vs Stanley Black & Decker, Inc.: Efficiency in Cost of Revenue Explored
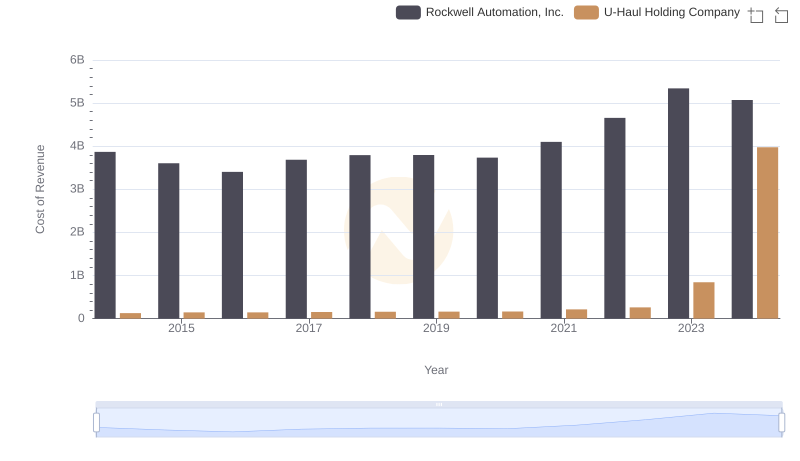
Analyzing Cost of Revenue: Rockwell Automation, Inc. and U-Haul Holding Company
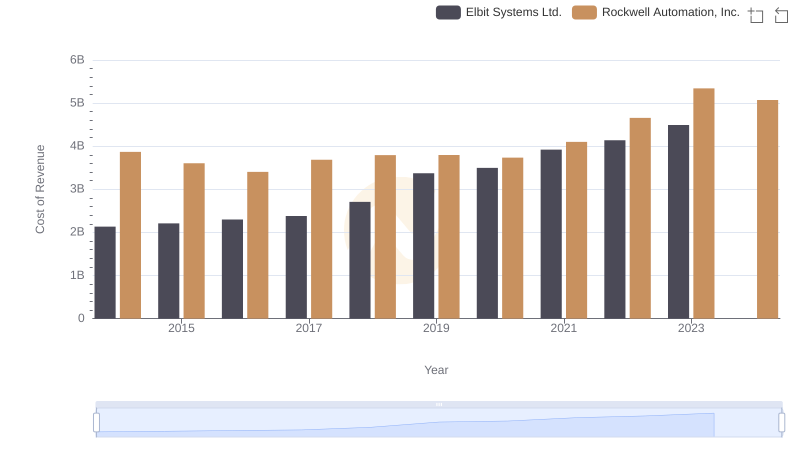
Cost Insights: Breaking Down Rockwell Automation, Inc. and Elbit Systems Ltd.'s Expenses
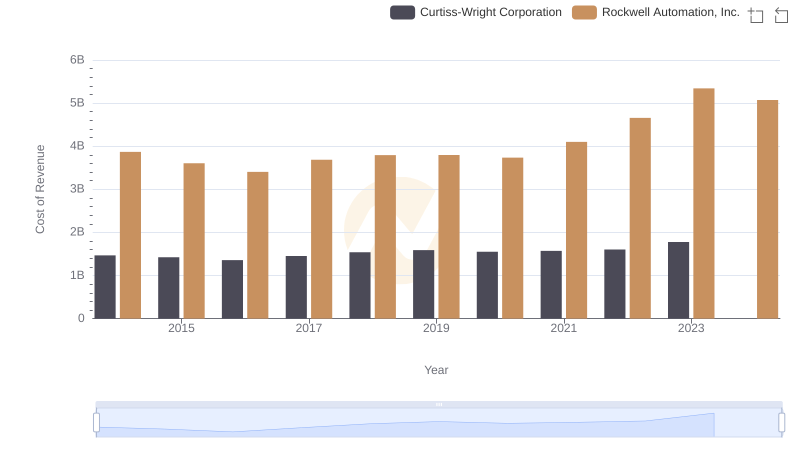
Cost of Revenue Trends: Rockwell Automation, Inc. vs Curtiss-Wright Corporation
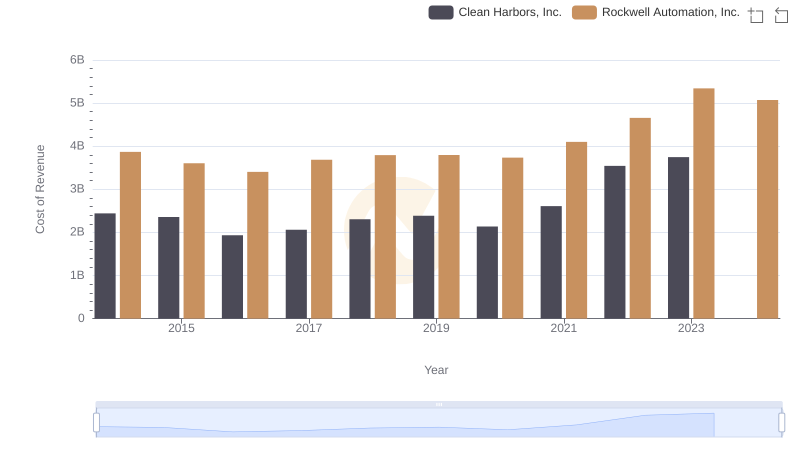
Comparing Cost of Revenue Efficiency: Rockwell Automation, Inc. vs Clean Harbors, Inc.
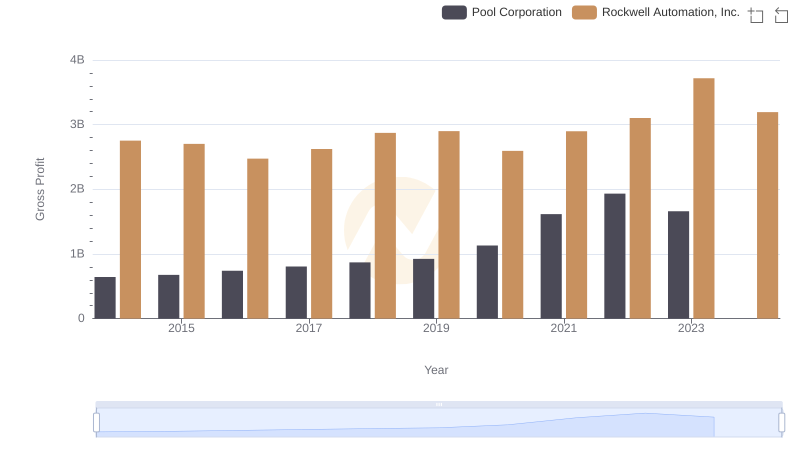
Rockwell Automation, Inc. and Pool Corporation: A Detailed Gross Profit Analysis

Comparing SG&A Expenses: Rockwell Automation, Inc. vs Pool Corporation Trends and Insights