| __timestamp | Pool Corporation | Rockwell Automation, Inc. |
|---|---|---|
| Wednesday, January 1, 2014 | 454470000 | 1570100000 |
| Thursday, January 1, 2015 | 459422000 | 1506400000 |
| Friday, January 1, 2016 | 485228000 | 1467400000 |
| Sunday, January 1, 2017 | 520918000 | 1591500000 |
| Monday, January 1, 2018 | 556284000 | 1599000000 |
| Tuesday, January 1, 2019 | 583679000 | 1538500000 |
| Wednesday, January 1, 2020 | 659931000 | 1479800000 |
| Friday, January 1, 2021 | 786808000 | 1680000000 |
| Saturday, January 1, 2022 | 907629000 | 1766700000 |
| Sunday, January 1, 2023 | 912927000 | 2023700000 |
| Monday, January 1, 2024 | 2002600000 |
Cracking the code
In the competitive landscape of industrial automation and pool supplies, Rockwell Automation, Inc. and Pool Corporation have shown distinct trends in their Selling, General, and Administrative (SG&A) expenses over the past decade. From 2014 to 2023, Rockwell Automation's SG&A expenses have consistently been higher, peaking at approximately $2 billion in 2023, marking a 29% increase from 2014. In contrast, Pool Corporation's expenses have grown more dramatically, nearly doubling from 2014 to 2023, reaching around $913 million. This growth reflects Pool Corporation's aggressive expansion strategy in the pool supply market. Notably, the data for 2024 is incomplete, highlighting the need for ongoing analysis. These trends underscore the strategic financial management differences between the two companies, offering insights into their operational priorities and market positioning.
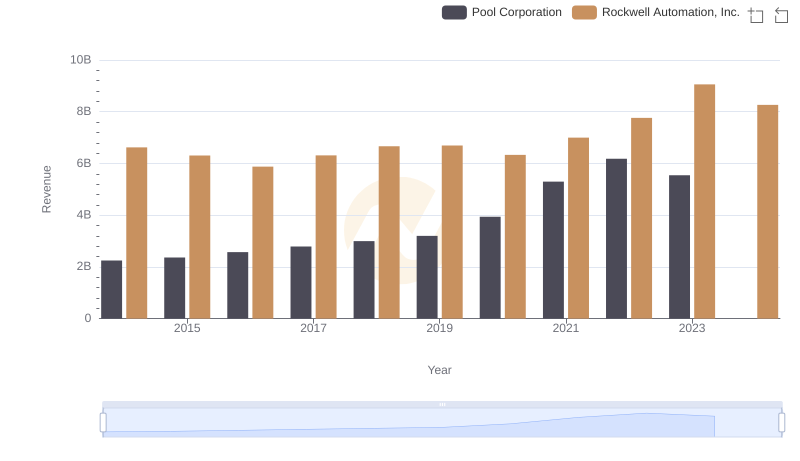
Annual Revenue Comparison: Rockwell Automation, Inc. vs Pool Corporation
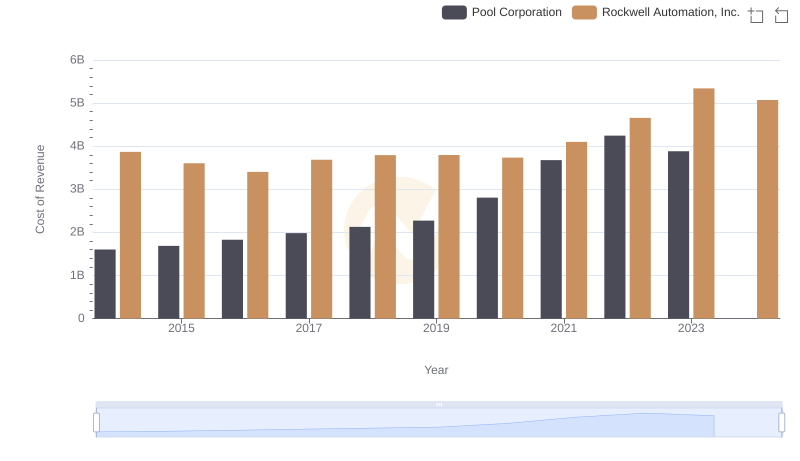
Analyzing Cost of Revenue: Rockwell Automation, Inc. and Pool Corporation
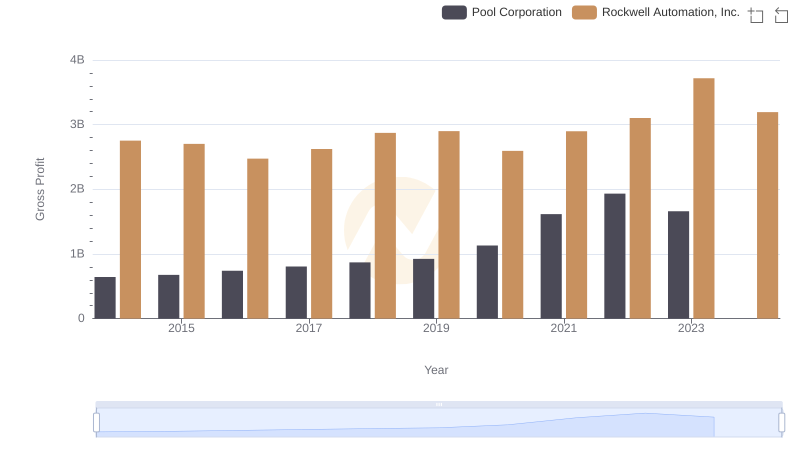
Rockwell Automation, Inc. and Pool Corporation: A Detailed Gross Profit Analysis
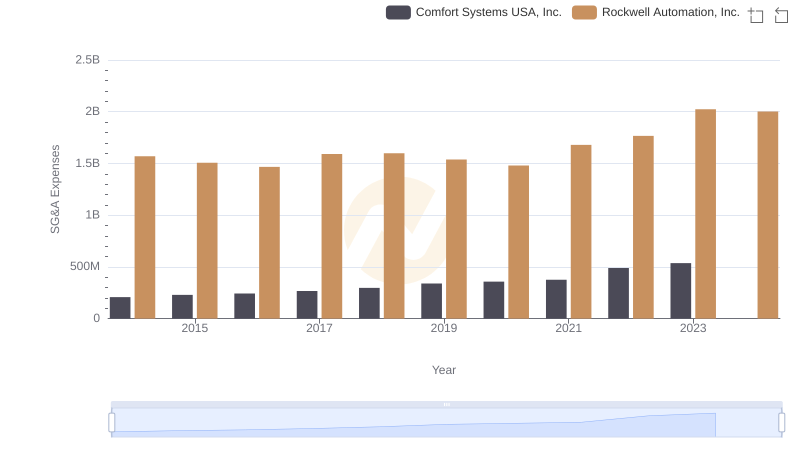
SG&A Efficiency Analysis: Comparing Rockwell Automation, Inc. and Comfort Systems USA, Inc.
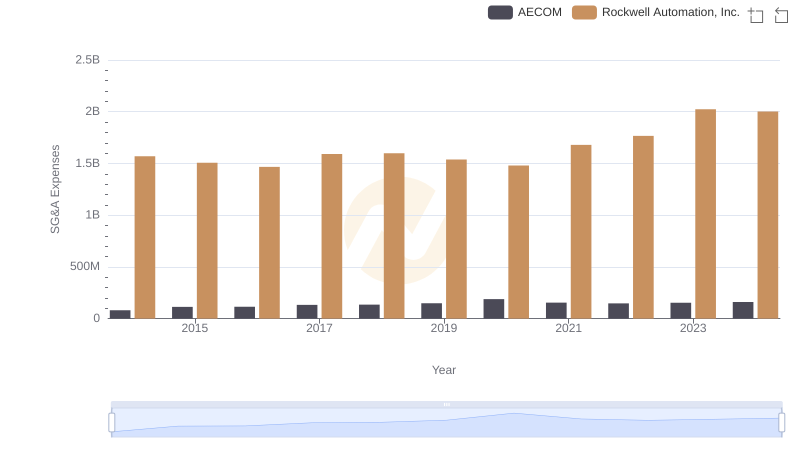
SG&A Efficiency Analysis: Comparing Rockwell Automation, Inc. and AECOM

SG&A Efficiency Analysis: Comparing Rockwell Automation, Inc. and U-Haul Holding Company
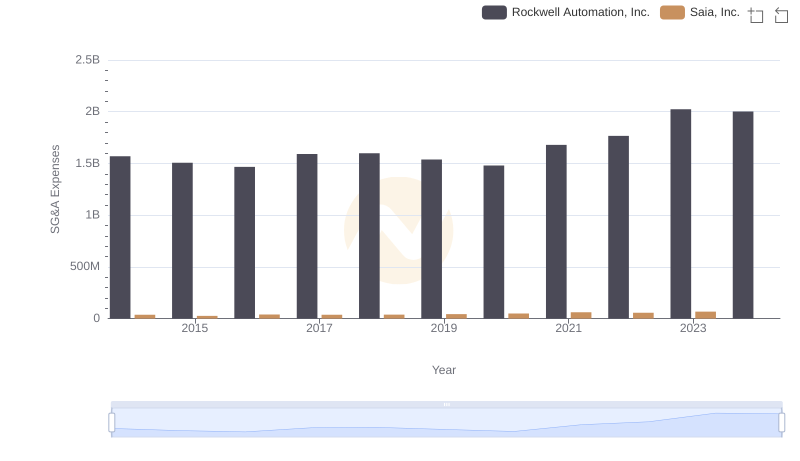
Comparing SG&A Expenses: Rockwell Automation, Inc. vs Saia, Inc. Trends and Insights

Who Optimizes SG&A Costs Better? Rockwell Automation, Inc. or Stanley Black & Decker, Inc.
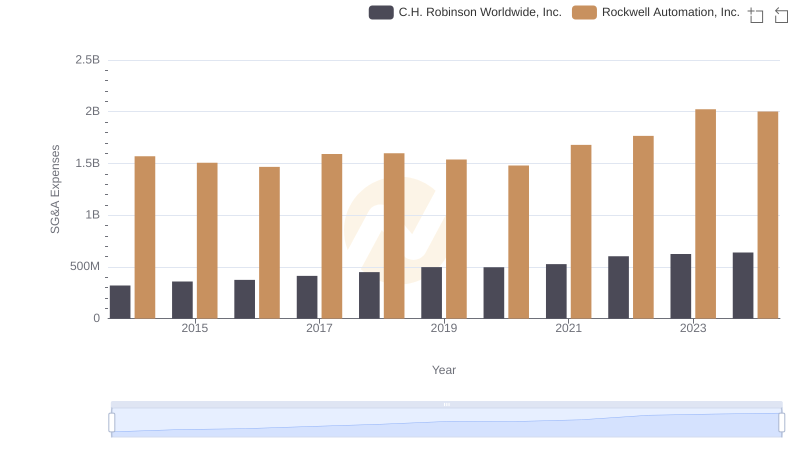
Cost Management Insights: SG&A Expenses for Rockwell Automation, Inc. and C.H. Robinson Worldwide, Inc.