| __timestamp | Pool Corporation | Rockwell Automation, Inc. |
|---|---|---|
| Wednesday, January 1, 2014 | 2246562000 | 6623500000 |
| Thursday, January 1, 2015 | 2363139000 | 6307900000 |
| Friday, January 1, 2016 | 2570803000 | 5879500000 |
| Sunday, January 1, 2017 | 2788188000 | 6311300000 |
| Monday, January 1, 2018 | 2998097000 | 6666000000 |
| Tuesday, January 1, 2019 | 3199517000 | 6694800000 |
| Wednesday, January 1, 2020 | 3936623000 | 6329800000 |
| Friday, January 1, 2021 | 5295584000 | 6997400000 |
| Saturday, January 1, 2022 | 6179727000 | 7760400000 |
| Sunday, January 1, 2023 | 5541595000 | 9058000000 |
| Monday, January 1, 2024 | 8264200000 |
Data in motion
In the ever-evolving landscape of industrial automation and pool supplies, Rockwell Automation and Pool Corporation have emerged as key players. Over the past decade, Rockwell Automation has consistently outperformed Pool Corporation in terms of annual revenue. From 2014 to 2023, Rockwell Automation's revenue grew by approximately 37%, peaking in 2023 with a remarkable $9.06 billion. In contrast, Pool Corporation saw a significant 147% increase in revenue, reaching its zenith in 2022 with $6.18 billion.
While Rockwell Automation maintained a steady growth trajectory, Pool Corporation experienced a more volatile journey, with a notable dip in 2023. This fluctuation highlights the dynamic nature of the pool supply industry compared to the relatively stable industrial automation sector. As we look to the future, the missing data for 2024 leaves room for speculation and anticipation.

Revenue Showdown: Rockwell Automation, Inc. vs CNH Industrial N.V.
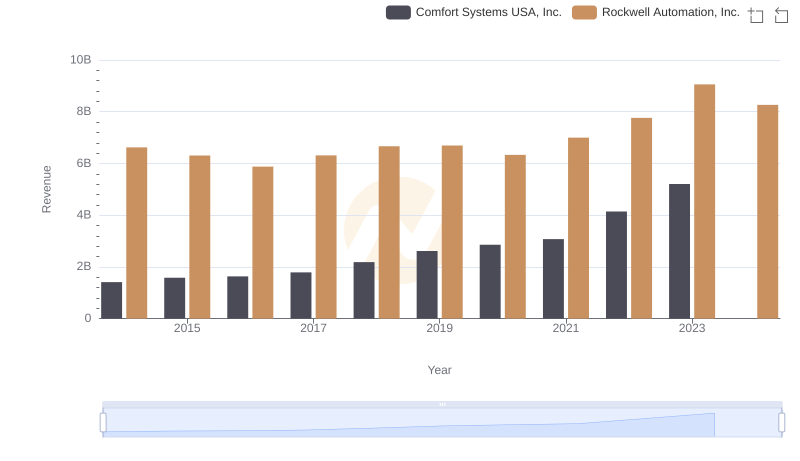
Comparing Revenue Performance: Rockwell Automation, Inc. or Comfort Systems USA, Inc.?
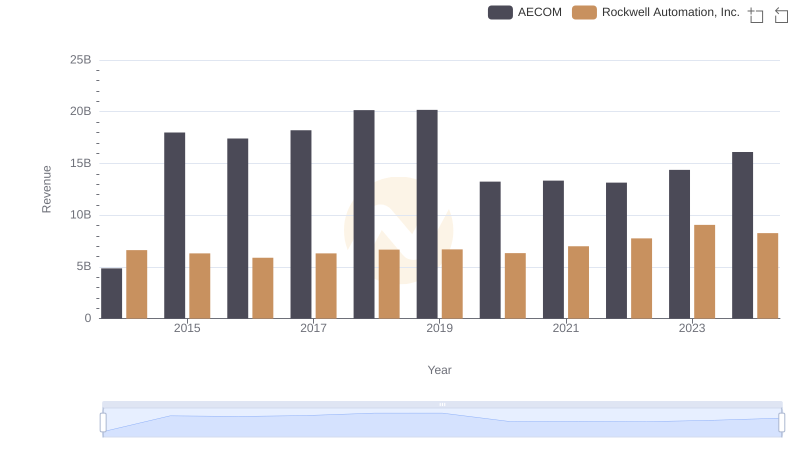
Breaking Down Revenue Trends: Rockwell Automation, Inc. vs AECOM

Revenue Showdown: Rockwell Automation, Inc. vs Saia, Inc.
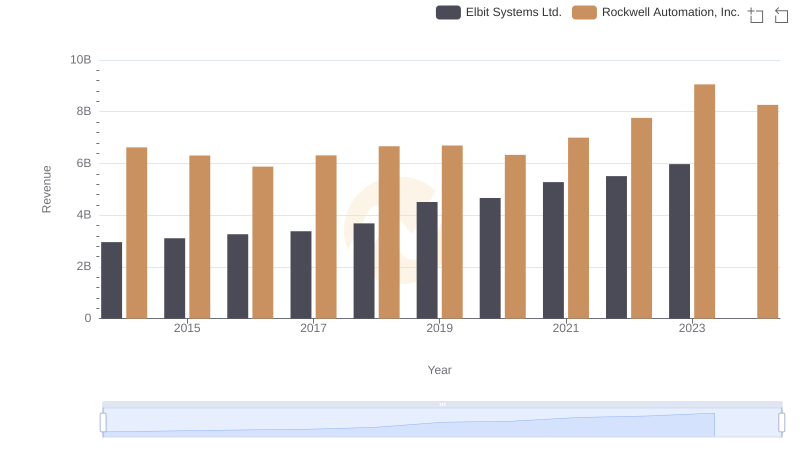
Revenue Showdown: Rockwell Automation, Inc. vs Elbit Systems Ltd.

Breaking Down Revenue Trends: Rockwell Automation, Inc. vs Curtiss-Wright Corporation
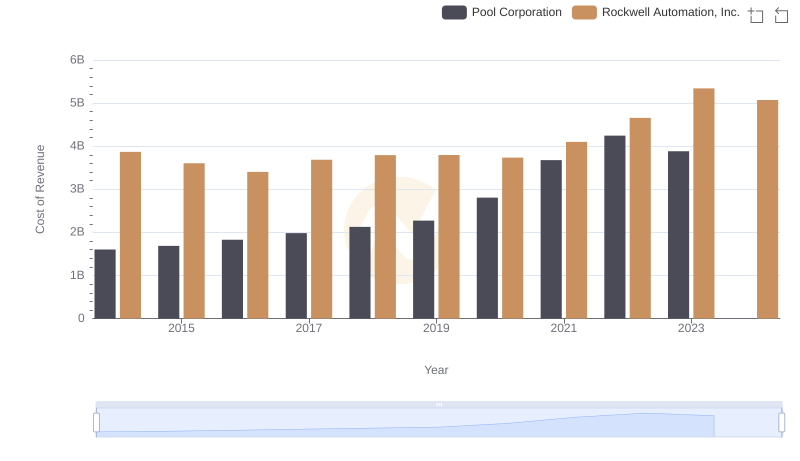
Analyzing Cost of Revenue: Rockwell Automation, Inc. and Pool Corporation
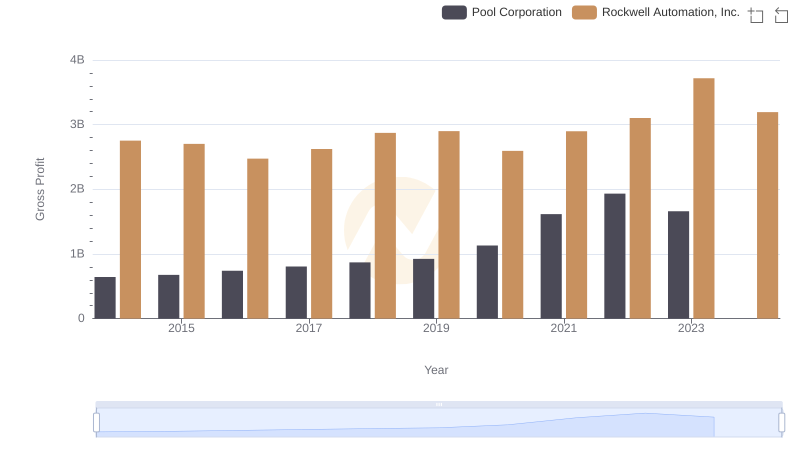
Rockwell Automation, Inc. and Pool Corporation: A Detailed Gross Profit Analysis

Comparing SG&A Expenses: Rockwell Automation, Inc. vs Pool Corporation Trends and Insights