| __timestamp | Lennox International Inc. | Watsco, Inc. |
|---|---|---|
| Wednesday, January 1, 2014 | 3367400000 | 3944540000 |
| Thursday, January 1, 2015 | 3467400000 | 4113239000 |
| Friday, January 1, 2016 | 3641600000 | 4220702000 |
| Sunday, January 1, 2017 | 3839600000 | 4341955000 |
| Monday, January 1, 2018 | 3883900000 | 4546653000 |
| Tuesday, January 1, 2019 | 3807200000 | 4770362000 |
| Wednesday, January 1, 2020 | 3634100000 | 5054928000 |
| Friday, January 1, 2021 | 4194100000 | 6280192000 |
| Saturday, January 1, 2022 | 4718400000 | 7274344000 |
| Sunday, January 1, 2023 | 4981900000 | 7283767000 |
| Monday, January 1, 2024 | 5341300000 | 7618317000 |
Unleashing the power of data
In the competitive landscape of the HVAC industry, Lennox International Inc. and Watsco, Inc. have been key players. Over the past decade, from 2014 to 2023, these companies have shown remarkable revenue growth. Lennox International Inc. has seen its revenue increase by approximately 59%, starting from $3.37 billion in 2014 to an impressive $5.34 billion in 2023. Meanwhile, Watsco, Inc. has outpaced Lennox with a 85% growth, reaching $7.28 billion in 2023 from $3.94 billion in 2014.
The data highlights a consistent upward trend for both companies, with Watsco maintaining a lead in revenue figures. However, the data for 2024 is incomplete, leaving room for speculation on future performance. This analysis provides a snapshot of the financial health and competitive dynamics between these two industry giants, offering valuable insights for investors and market analysts.
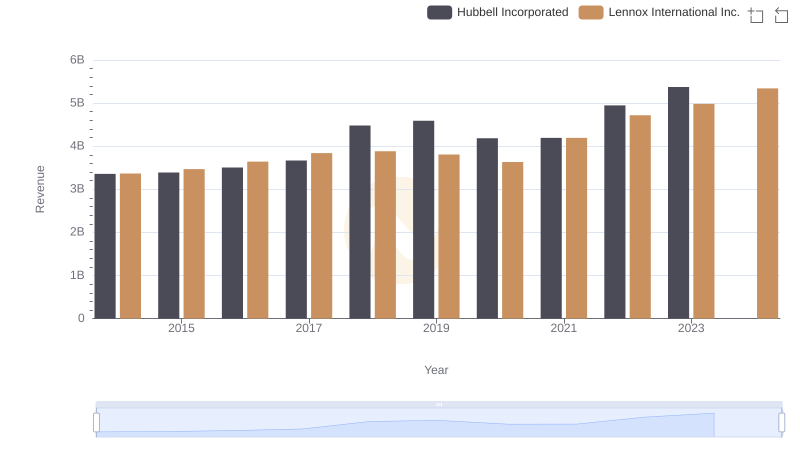
Revenue Showdown: Lennox International Inc. vs Hubbell Incorporated
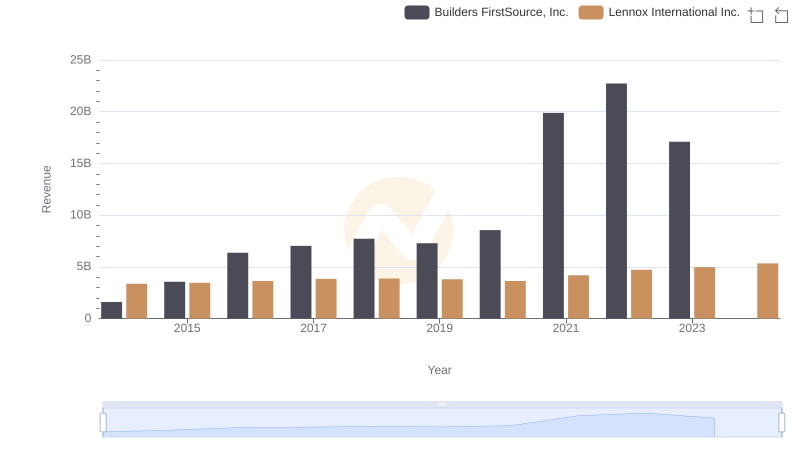
Lennox International Inc. and Builders FirstSource, Inc.: A Comprehensive Revenue Analysis
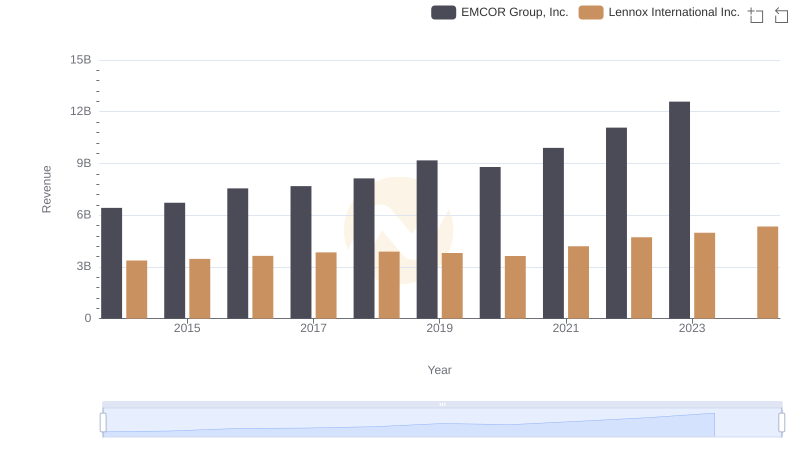
Who Generates More Revenue? Lennox International Inc. or EMCOR Group, Inc.
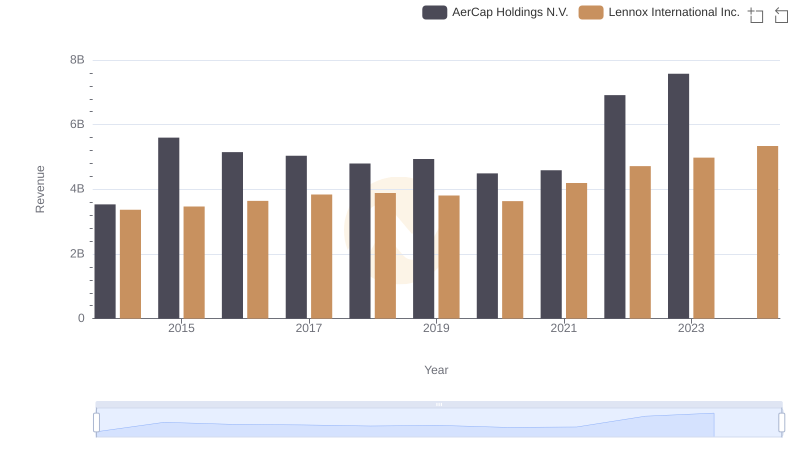
Annual Revenue Comparison: Lennox International Inc. vs AerCap Holdings N.V.
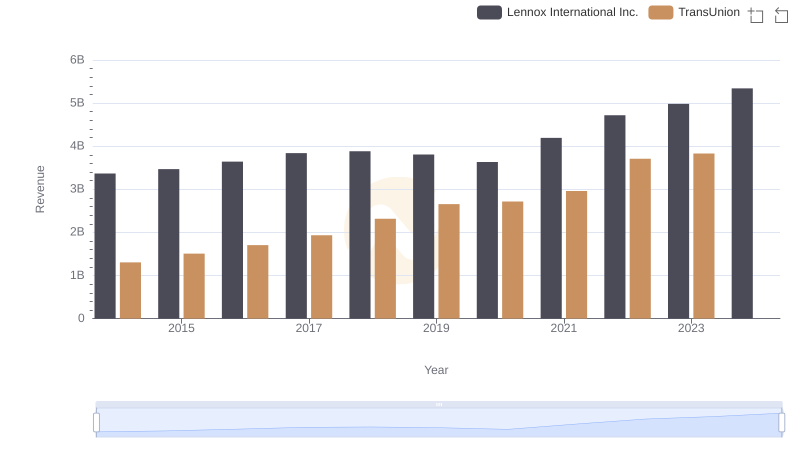
Lennox International Inc. vs TransUnion: Examining Key Revenue Metrics
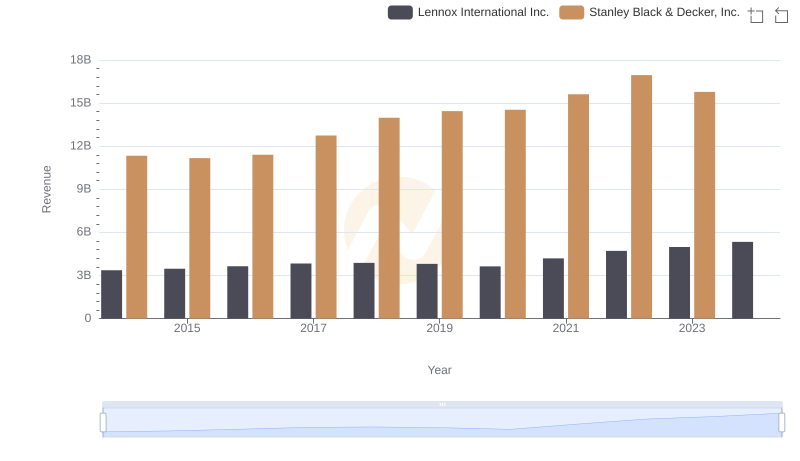
Lennox International Inc. vs Stanley Black & Decker, Inc.: Annual Revenue Growth Compared
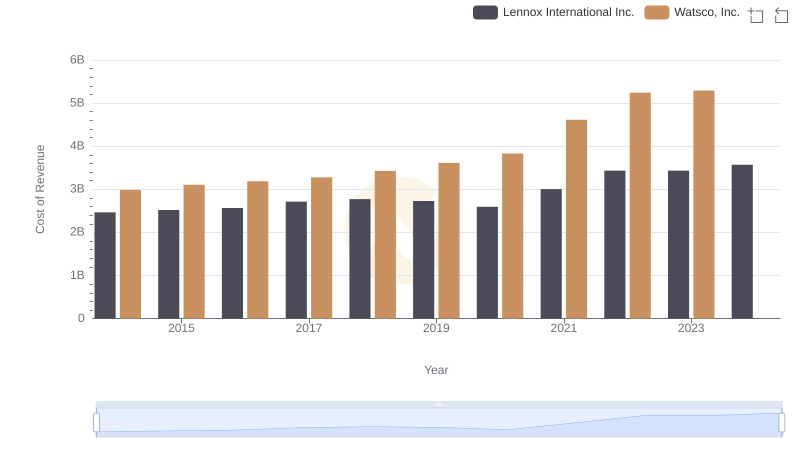
Cost of Revenue Trends: Lennox International Inc. vs Watsco, Inc.
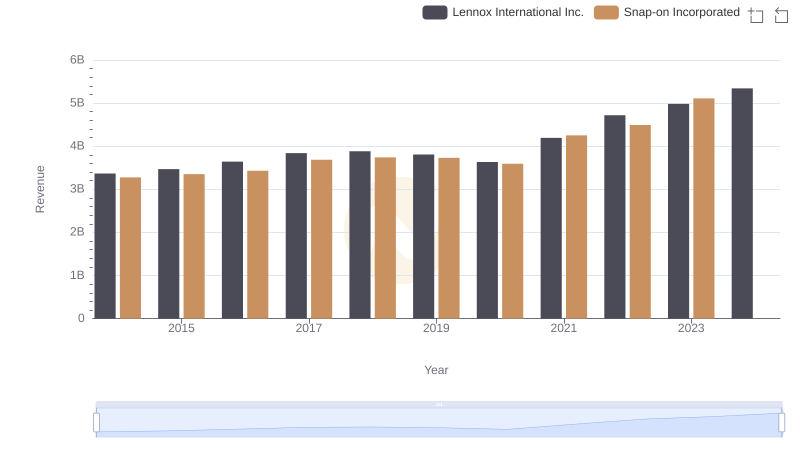
Lennox International Inc. vs Snap-on Incorporated: Examining Key Revenue Metrics
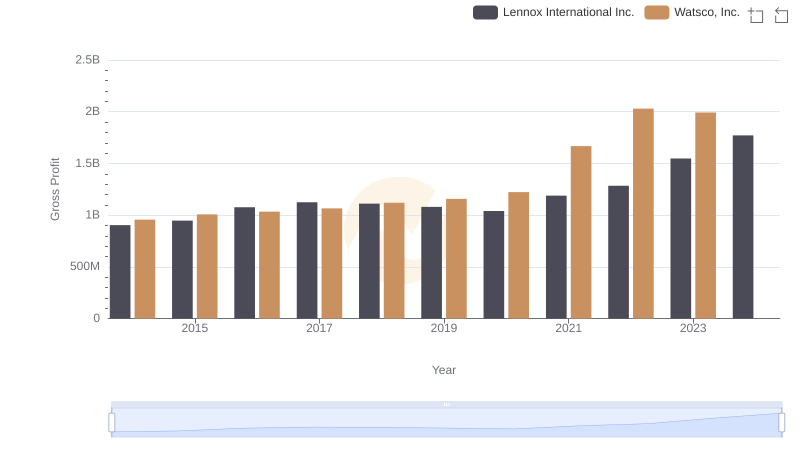
Lennox International Inc. and Watsco, Inc.: A Detailed Gross Profit Analysis
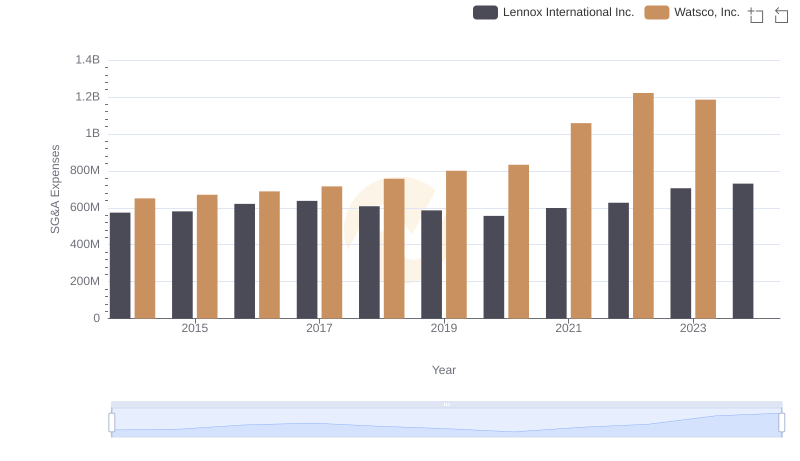
Operational Costs Compared: SG&A Analysis of Lennox International Inc. and Watsco, Inc.
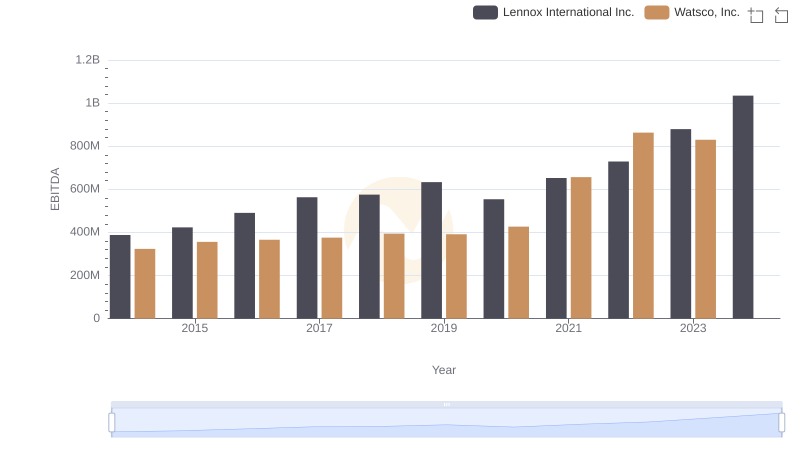
A Professional Review of EBITDA: Lennox International Inc. Compared to Watsco, Inc.