| __timestamp | Lennox International Inc. | Stanley Black & Decker, Inc. |
|---|---|---|
| Wednesday, January 1, 2014 | 3367400000 | 11338600000 |
| Thursday, January 1, 2015 | 3467400000 | 11171800000 |
| Friday, January 1, 2016 | 3641600000 | 11406900000 |
| Sunday, January 1, 2017 | 3839600000 | 12747200000 |
| Monday, January 1, 2018 | 3883900000 | 13982400000 |
| Tuesday, January 1, 2019 | 3807200000 | 14442200000 |
| Wednesday, January 1, 2020 | 3634100000 | 14534600000 |
| Friday, January 1, 2021 | 4194100000 | 15617200000 |
| Saturday, January 1, 2022 | 4718400000 | 16947400000 |
| Sunday, January 1, 2023 | 4981900000 | 15781100000 |
| Monday, January 1, 2024 | 5341300000 | 15365700000 |
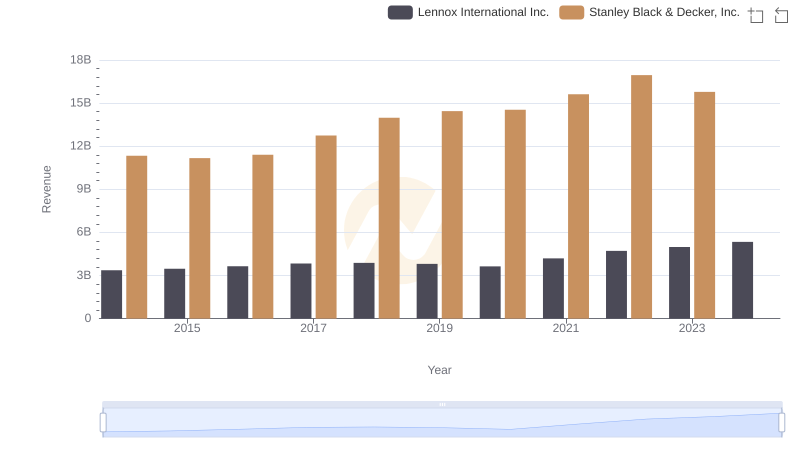
Unleashing insights
In the ever-evolving landscape of industrial manufacturing, Lennox International Inc. and Stanley Black & Decker, Inc. have been pivotal players. Over the past decade, Lennox has demonstrated a robust revenue growth, increasing by approximately 59% from 2014 to 2024. This growth trajectory highlights Lennox's strategic market positioning and adaptability in a competitive environment.
Conversely, Stanley Black & Decker, Inc. experienced a steady climb in revenue until 2022, with a notable peak in 2022, reaching nearly 50% higher than its 2014 figures. However, the data for 2024 is missing, leaving a gap in understanding their recent performance.
This comparison underscores the dynamic nature of the industrial sector, where companies must continuously innovate to maintain growth. As we look to the future, the resilience and strategic decisions of these companies will be crucial in shaping their trajectories.
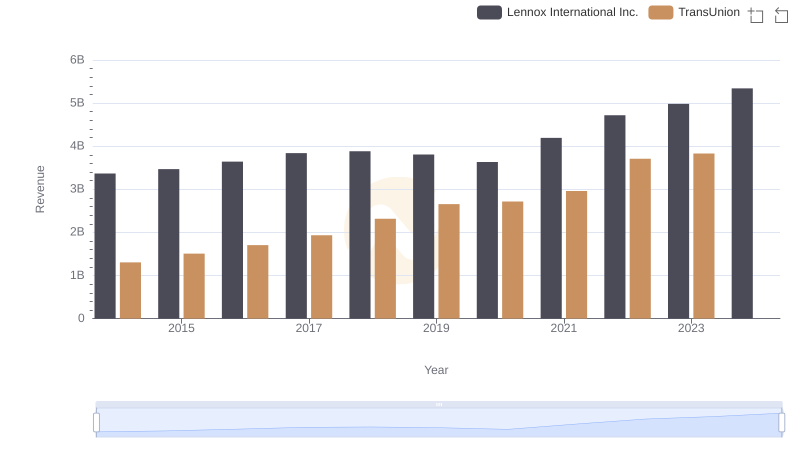
Lennox International Inc. vs TransUnion: Examining Key Revenue Metrics
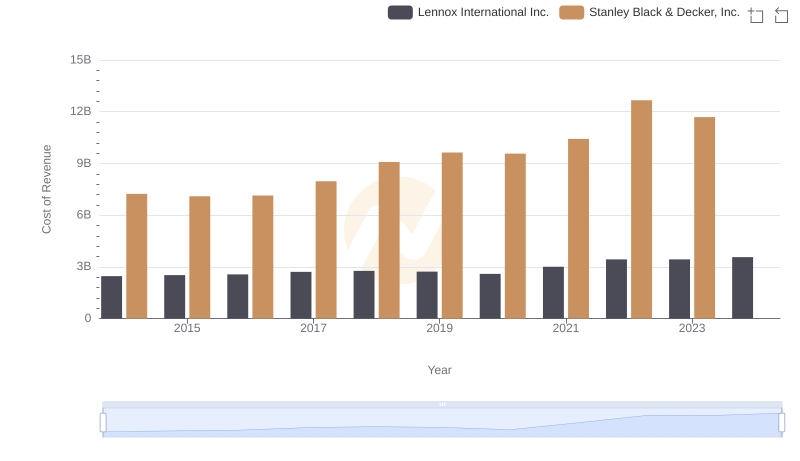
Lennox International Inc. vs Stanley Black & Decker, Inc.: Efficiency in Cost of Revenue Explored

Key Insights on Gross Profit: Lennox International Inc. vs Stanley Black & Decker, Inc.
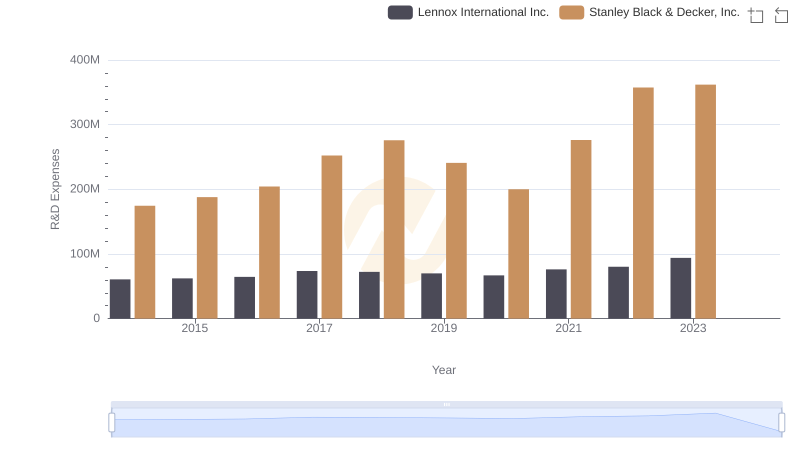
Research and Development Expenses Breakdown: Lennox International Inc. vs Stanley Black & Decker, Inc.
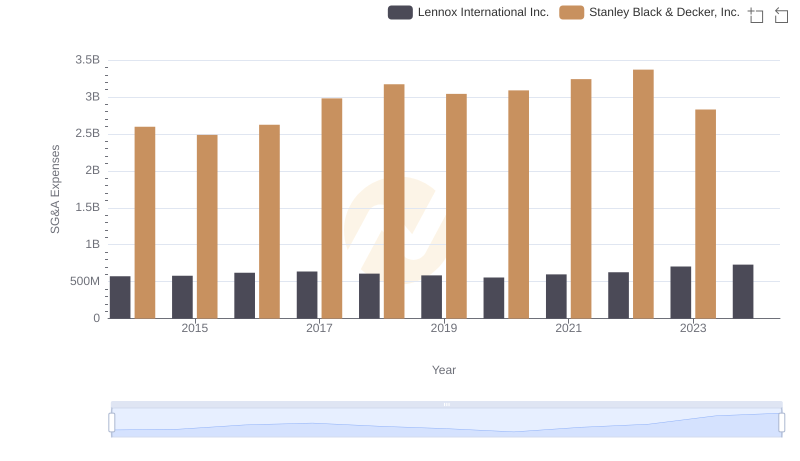
Who Optimizes SG&A Costs Better? Lennox International Inc. or Stanley Black & Decker, Inc.

A Professional Review of EBITDA: Lennox International Inc. Compared to Stanley Black & Decker, Inc.
Lennox International Inc. and Stanley Black & Decker, Inc.: A Comprehensive Revenue Analysis

Analyzing Cost of Revenue: Lennox International Inc. and Stanley Black & Decker, Inc.
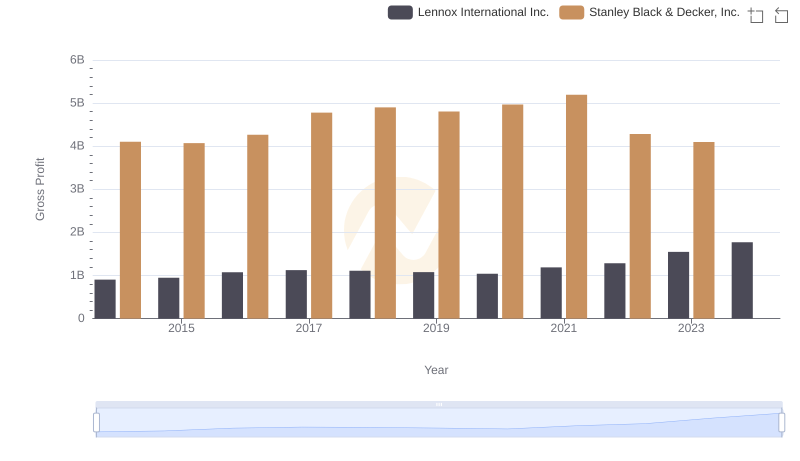
Lennox International Inc. vs Stanley Black & Decker, Inc.: A Gross Profit Performance Breakdown

Research and Development: Comparing Key Metrics for Lennox International Inc. and Stanley Black & Decker, Inc.

Comparing SG&A Expenses: Lennox International Inc. vs Stanley Black & Decker, Inc. Trends and Insights

Professional EBITDA Benchmarking: Lennox International Inc. vs Stanley Black & Decker, Inc.