| __timestamp | Lennox International Inc. | Stanley Black & Decker, Inc. |
|---|---|---|
| Wednesday, January 1, 2014 | 60700000 | 174600000 |
| Thursday, January 1, 2015 | 62300000 | 188000000 |
| Friday, January 1, 2016 | 64599999 | 204400000 |
| Sunday, January 1, 2017 | 73600000 | 252300000 |
| Monday, January 1, 2018 | 72200000 | 275800000 |
| Tuesday, January 1, 2019 | 69900000 | 240800000 |
| Wednesday, January 1, 2020 | 66800000 | 200000000 |
| Friday, January 1, 2021 | 76100000 | 276300000 |
| Saturday, January 1, 2022 | 80300000 | 357400000 |
| Sunday, January 1, 2023 | 94000000 | 362000000 |
| Monday, January 1, 2024 | 0 | 0 |
Unleashing the power of data
In the ever-evolving landscape of industrial innovation, research and development (R&D) play a pivotal role. Over the past decade, Lennox International Inc. and Stanley Black & Decker, Inc. have demonstrated contrasting approaches to R&D investment. From 2014 to 2023, Lennox International's R&D expenses grew by approximately 55%, peaking in 2023. Meanwhile, Stanley Black & Decker's R&D spending surged by over 100%, reaching its zenith in the same year.
This trend underscores a strategic emphasis on innovation, with Stanley Black & Decker consistently allocating a larger portion of its resources to R&D compared to Lennox International. The data reveals a commitment to technological advancement, crucial for maintaining competitive advantage in their respective industries. However, the absence of data for 2024 suggests a potential shift or reevaluation in their R&D strategies, leaving room for speculation on future trends.

Lennox International Inc. vs Stanley Black & Decker, Inc.: Annual Revenue Growth Compared
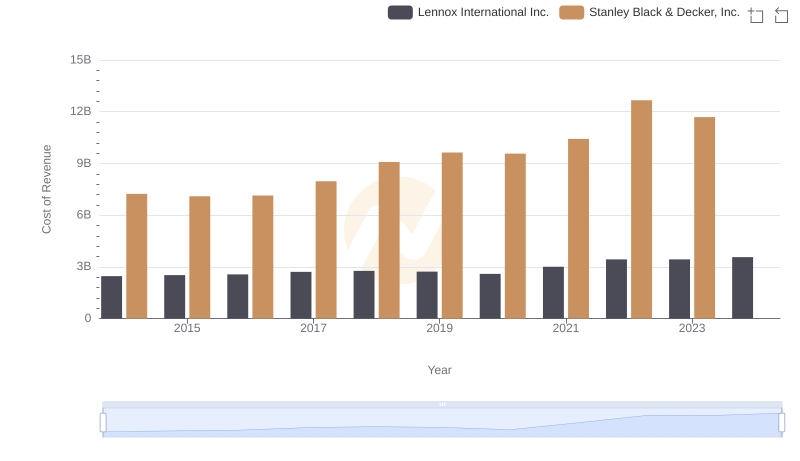
Lennox International Inc. vs Stanley Black & Decker, Inc.: Efficiency in Cost of Revenue Explored

Key Insights on Gross Profit: Lennox International Inc. vs Stanley Black & Decker, Inc.
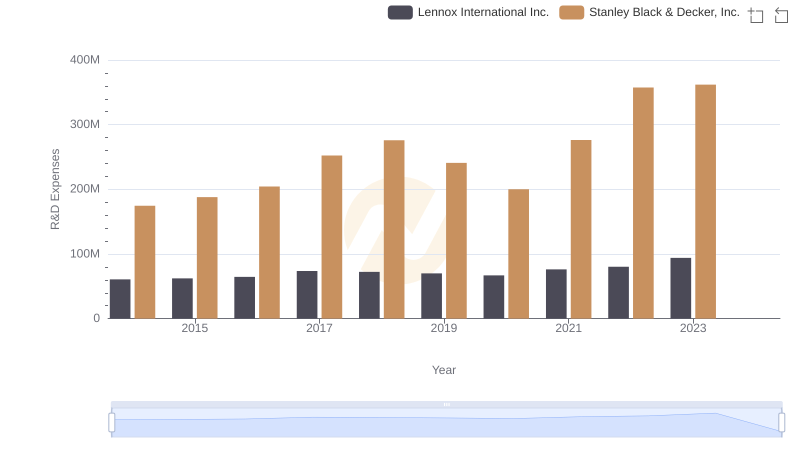
Research and Development Expenses Breakdown: Lennox International Inc. vs Stanley Black & Decker, Inc.
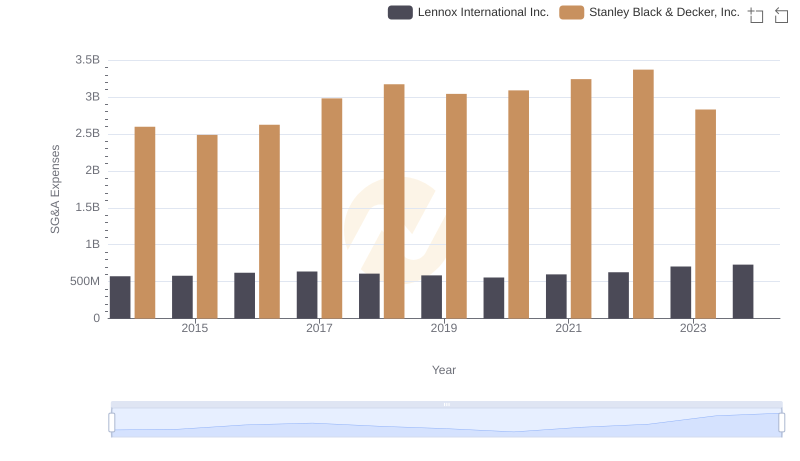
Who Optimizes SG&A Costs Better? Lennox International Inc. or Stanley Black & Decker, Inc.

A Professional Review of EBITDA: Lennox International Inc. Compared to Stanley Black & Decker, Inc.
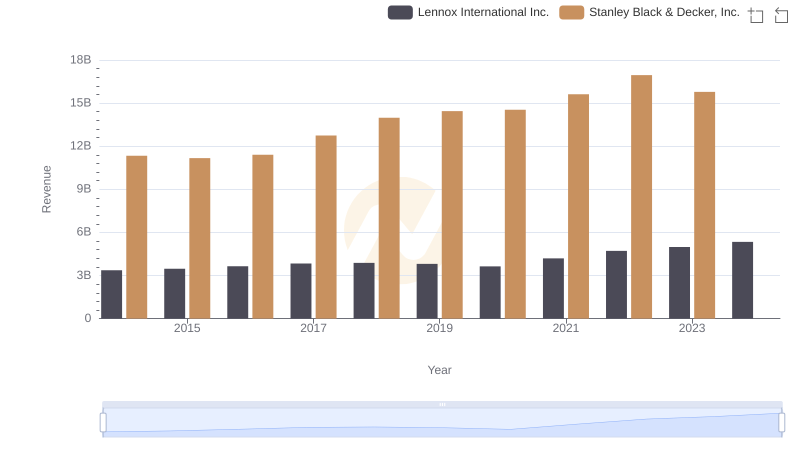
Lennox International Inc. and Stanley Black & Decker, Inc.: A Comprehensive Revenue Analysis

Analyzing Cost of Revenue: Lennox International Inc. and Stanley Black & Decker, Inc.
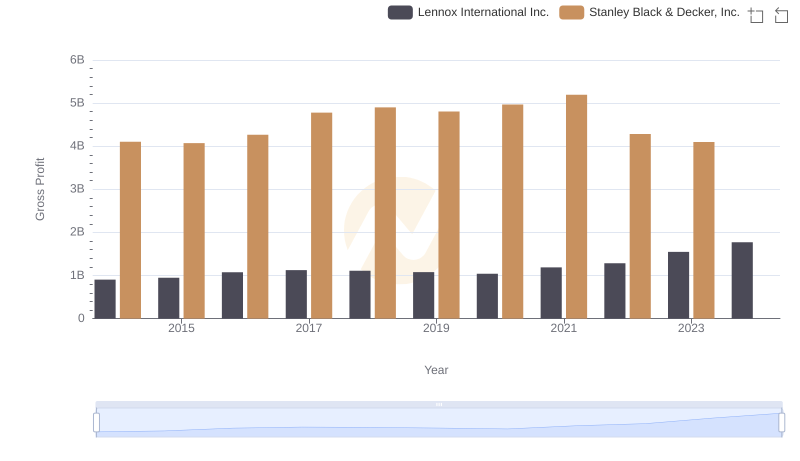
Lennox International Inc. vs Stanley Black & Decker, Inc.: A Gross Profit Performance Breakdown
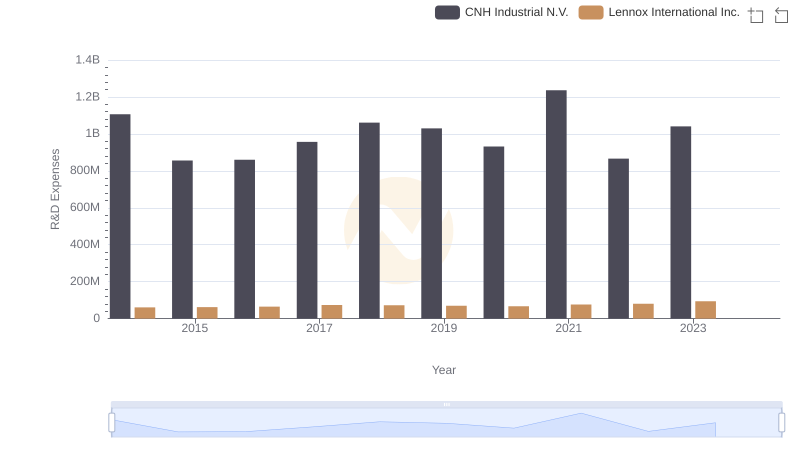
Comparing Innovation Spending: Lennox International Inc. and CNH Industrial N.V.

Comparing SG&A Expenses: Lennox International Inc. vs Stanley Black & Decker, Inc. Trends and Insights

Professional EBITDA Benchmarking: Lennox International Inc. vs Stanley Black & Decker, Inc.