| __timestamp | Lennox International Inc. | Stanley Black & Decker, Inc. |
|---|---|---|
| Wednesday, January 1, 2014 | 2464100000 | 7235900000 |
| Thursday, January 1, 2015 | 2520000000 | 7099800000 |
| Friday, January 1, 2016 | 2565100000 | 7139700000 |
| Sunday, January 1, 2017 | 2714400000 | 7969200000 |
| Monday, January 1, 2018 | 2772700000 | 9080500000 |
| Tuesday, January 1, 2019 | 2727400000 | 9636700000 |
| Wednesday, January 1, 2020 | 2594000000 | 9566700000 |
| Friday, January 1, 2021 | 3005700000 | 10423000000 |
| Saturday, January 1, 2022 | 3433700000 | 12663300000 |
| Sunday, January 1, 2023 | 3434100000 | 11683100000 |
| Monday, January 1, 2024 | 3569400000 | 10851300000 |
Unlocking the unknown
In the competitive landscape of industrial manufacturing, cost efficiency is a critical metric. Lennox International Inc. and Stanley Black & Decker, Inc. have been key players in this arena. From 2014 to 2023, Lennox International Inc. demonstrated a steady increase in cost of revenue, peaking at approximately $3.57 billion in 2024. This represents a growth of nearly 45% over the decade. Meanwhile, Stanley Black & Decker, Inc. saw its cost of revenue rise by about 61% from 2014 to 2022, reaching a high of $12.66 billion in 2022. However, data for 2024 is missing, leaving a gap in the analysis. This comparison highlights the dynamic nature of cost management strategies in the industry, with both companies showcasing different trajectories in their financial efficiency.

Lennox International Inc. vs Stanley Black & Decker, Inc.: Annual Revenue Growth Compared
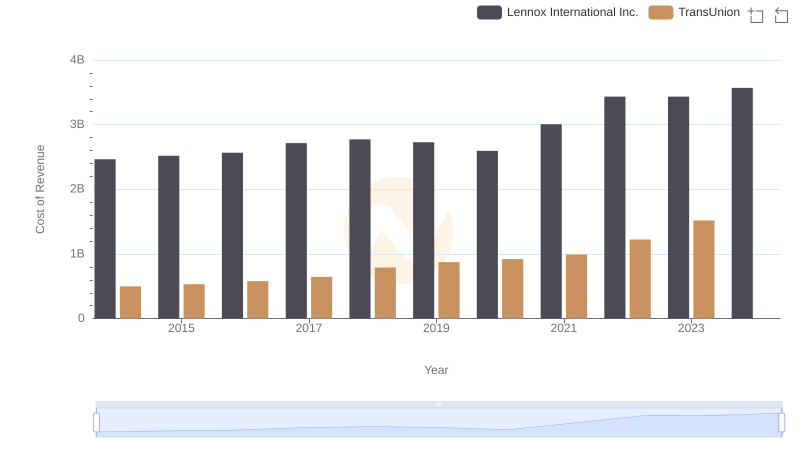
Comparing Cost of Revenue Efficiency: Lennox International Inc. vs TransUnion

Key Insights on Gross Profit: Lennox International Inc. vs Stanley Black & Decker, Inc.
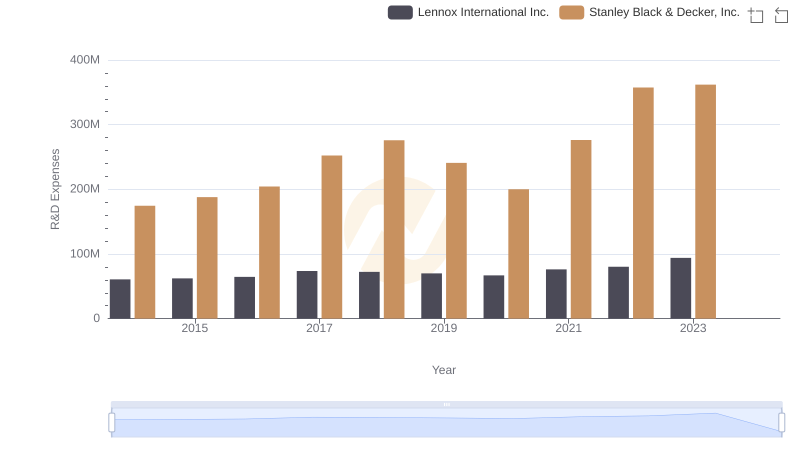
Research and Development Expenses Breakdown: Lennox International Inc. vs Stanley Black & Decker, Inc.
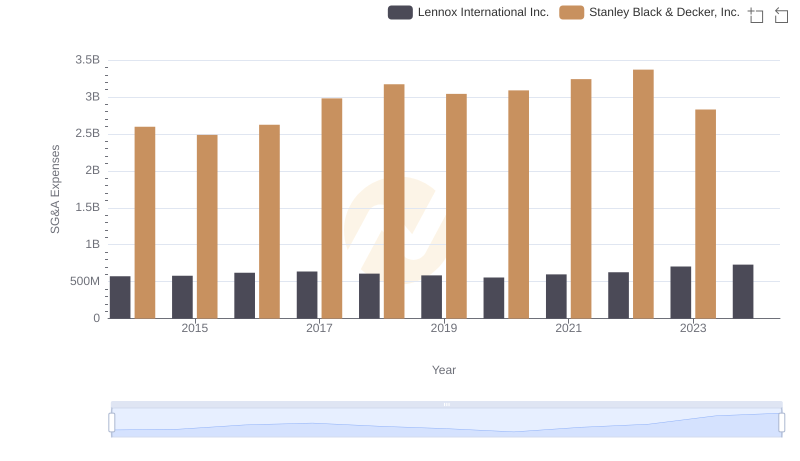
Who Optimizes SG&A Costs Better? Lennox International Inc. or Stanley Black & Decker, Inc.

A Professional Review of EBITDA: Lennox International Inc. Compared to Stanley Black & Decker, Inc.
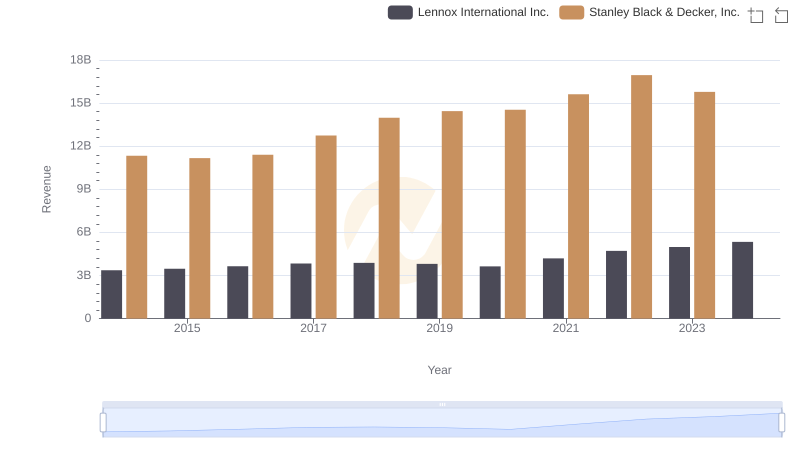
Lennox International Inc. and Stanley Black & Decker, Inc.: A Comprehensive Revenue Analysis
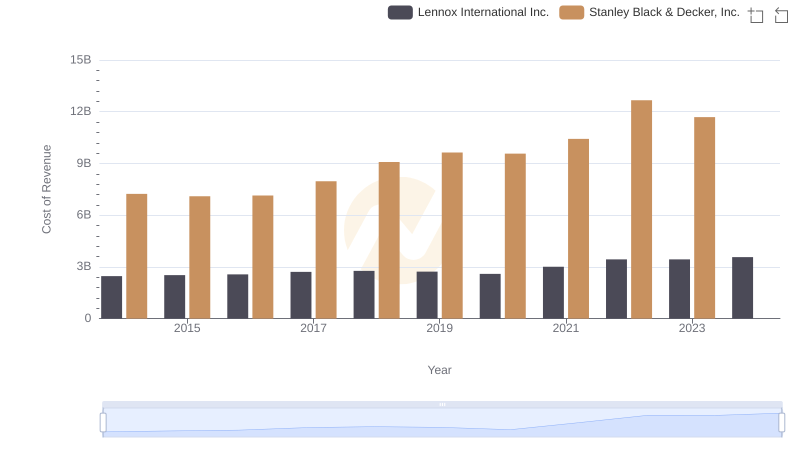
Analyzing Cost of Revenue: Lennox International Inc. and Stanley Black & Decker, Inc.
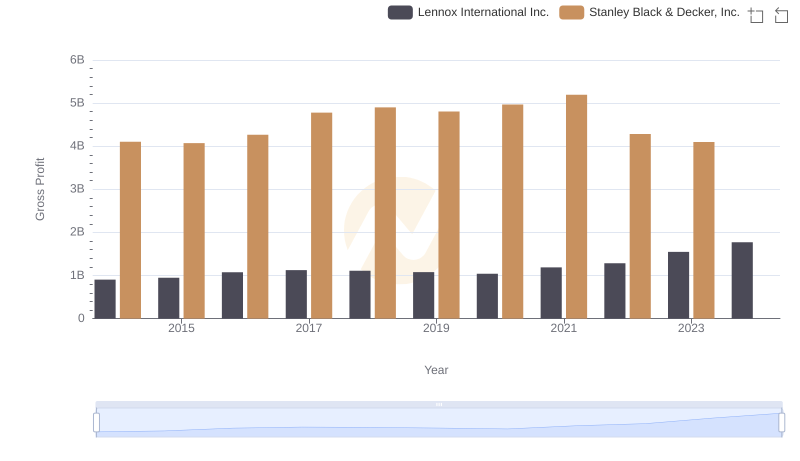
Lennox International Inc. vs Stanley Black & Decker, Inc.: A Gross Profit Performance Breakdown

Research and Development: Comparing Key Metrics for Lennox International Inc. and Stanley Black & Decker, Inc.

Comparing SG&A Expenses: Lennox International Inc. vs Stanley Black & Decker, Inc. Trends and Insights

Professional EBITDA Benchmarking: Lennox International Inc. vs Stanley Black & Decker, Inc.