| __timestamp | Lennox International Inc. | Stanley Black & Decker, Inc. |
|---|---|---|
| Wednesday, January 1, 2014 | 3367400000 | 11338600000 |
| Thursday, January 1, 2015 | 3467400000 | 11171800000 |
| Friday, January 1, 2016 | 3641600000 | 11406900000 |
| Sunday, January 1, 2017 | 3839600000 | 12747200000 |
| Monday, January 1, 2018 | 3883900000 | 13982400000 |
| Tuesday, January 1, 2019 | 3807200000 | 14442200000 |
| Wednesday, January 1, 2020 | 3634100000 | 14534600000 |
| Friday, January 1, 2021 | 4194100000 | 15617200000 |
| Saturday, January 1, 2022 | 4718400000 | 16947400000 |
| Sunday, January 1, 2023 | 4981900000 | 15781100000 |
| Monday, January 1, 2024 | 5341300000 | 15365700000 |
Unleashing insights
In the ever-evolving landscape of industrial manufacturing, Lennox International Inc. and Stanley Black & Decker, Inc. have consistently demonstrated their prowess. Over the past decade, Lennox International has seen a remarkable 59% increase in revenue, growing from approximately $3.4 billion in 2014 to an impressive $5.3 billion in 2024. This growth underscores their strategic market positioning and innovative product offerings.
Conversely, Stanley Black & Decker, Inc. experienced a robust 50% revenue surge from 2014 to 2022, peaking at $16.9 billion. However, 2023 saw a slight dip, highlighting potential market challenges or strategic shifts. Notably, data for 2024 is unavailable, leaving room for speculation on their future trajectory.
These trends reflect broader industry dynamics, where adaptability and innovation are key to sustaining growth in a competitive market.
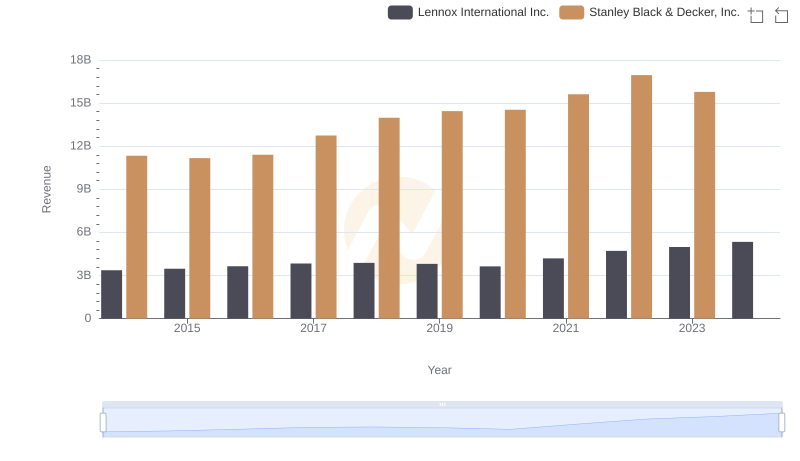
Lennox International Inc. vs Stanley Black & Decker, Inc.: Annual Revenue Growth Compared
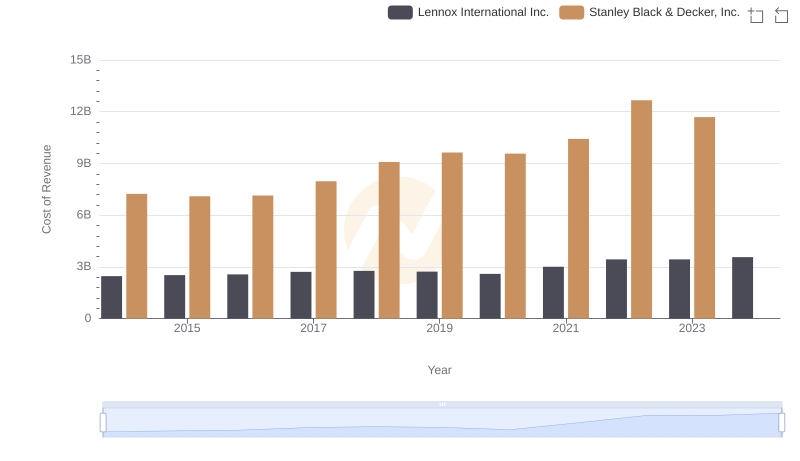
Lennox International Inc. vs Stanley Black & Decker, Inc.: Efficiency in Cost of Revenue Explored

Key Insights on Gross Profit: Lennox International Inc. vs Stanley Black & Decker, Inc.
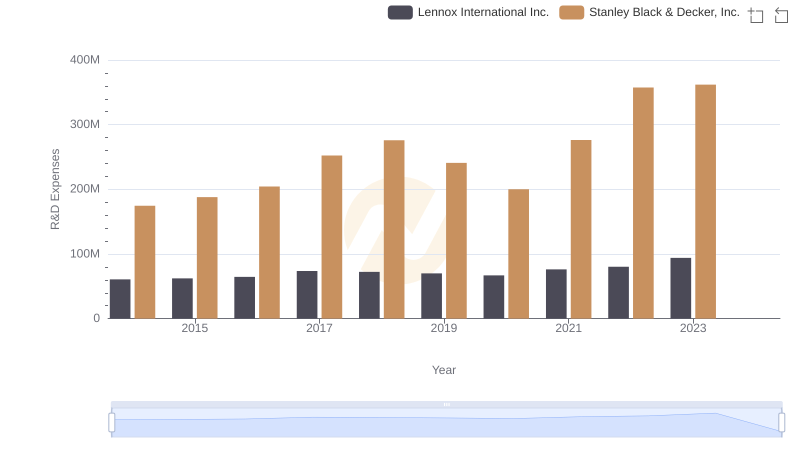
Research and Development Expenses Breakdown: Lennox International Inc. vs Stanley Black & Decker, Inc.
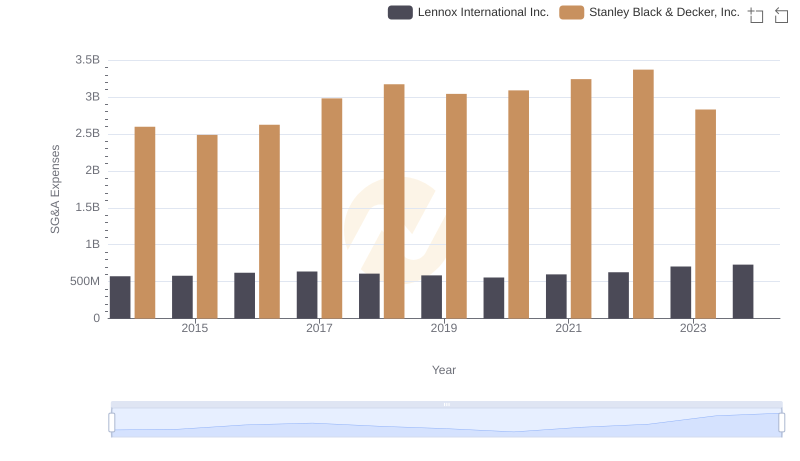
Who Optimizes SG&A Costs Better? Lennox International Inc. or Stanley Black & Decker, Inc.

A Professional Review of EBITDA: Lennox International Inc. Compared to Stanley Black & Decker, Inc.
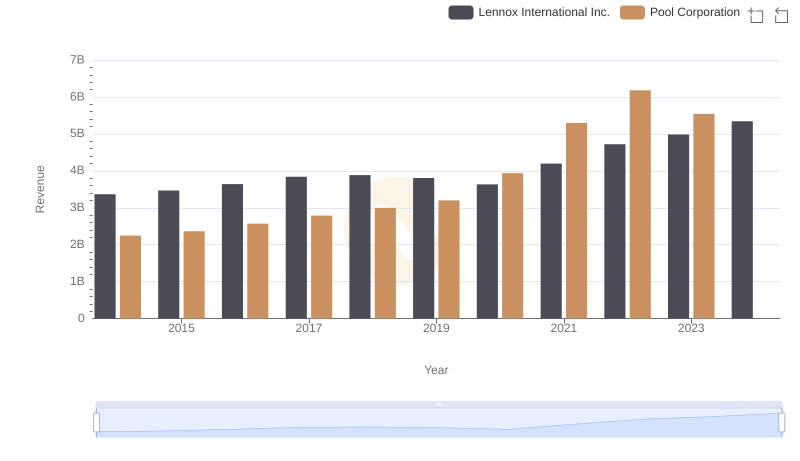
Lennox International Inc. vs Pool Corporation: Annual Revenue Growth Compared

Analyzing Cost of Revenue: Lennox International Inc. and Stanley Black & Decker, Inc.
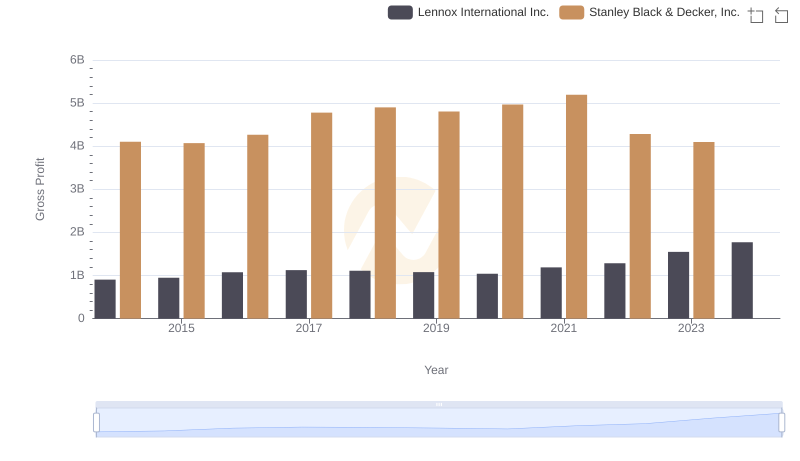
Lennox International Inc. vs Stanley Black & Decker, Inc.: A Gross Profit Performance Breakdown

Research and Development: Comparing Key Metrics for Lennox International Inc. and Stanley Black & Decker, Inc.

Comparing SG&A Expenses: Lennox International Inc. vs Stanley Black & Decker, Inc. Trends and Insights

Professional EBITDA Benchmarking: Lennox International Inc. vs Stanley Black & Decker, Inc.