| __timestamp | Graco Inc. | Waste Connections, Inc. |
|---|---|---|
| Wednesday, January 1, 2014 | 369321000 | 717805000 |
| Thursday, January 1, 2015 | 346732000 | 191002871 |
| Friday, January 1, 2016 | 354454000 | 900371894 |
| Sunday, January 1, 2017 | 408879000 | 1380632000 |
| Monday, January 1, 2018 | 472905000 | 1442229014 |
| Tuesday, January 1, 2019 | 466687000 | 1650754605 |
| Wednesday, January 1, 2020 | 440431000 | 1597555000 |
| Friday, January 1, 2021 | 578005000 | 1891001000 |
| Saturday, January 1, 2022 | 641618000 | 2090554149 |
| Sunday, January 1, 2023 | 686593000 | 2261354000 |
| Monday, January 1, 2024 | 570098000 | 2389779000 |
Igniting the spark of knowledge
In the competitive landscape of industrial services, Waste Connections, Inc. and Graco Inc. have shown remarkable financial trajectories over the past decade. From 2014 to 2023, Waste Connections, Inc. has consistently outperformed Graco Inc. in terms of EBITDA, with a peak in 2023 reaching approximately 2.26 billion, marking a growth of over 215% from its 2015 low. Graco Inc., while trailing, has demonstrated steady growth, peaking in 2023 with an EBITDA of around 687 million, a 98% increase from 2015. This data highlights Waste Connections, Inc.'s robust expansion strategy and Graco Inc.'s resilience in maintaining a competitive edge. Notably, the data for 2024 is incomplete, indicating potential shifts in the market dynamics. As these companies continue to evolve, stakeholders should watch for strategic moves that could influence future financial performance.
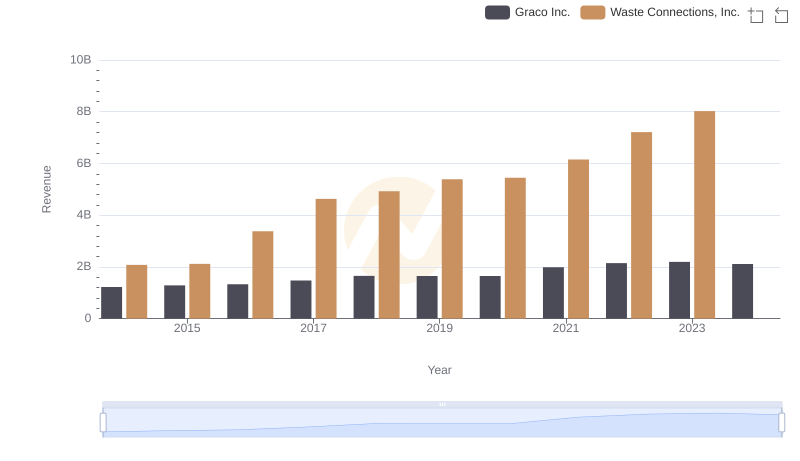
Annual Revenue Comparison: Waste Connections, Inc. vs Graco Inc.
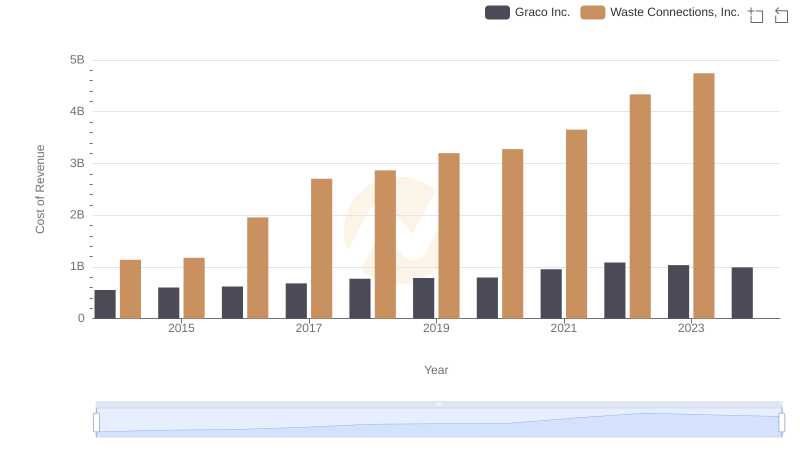
Cost of Revenue: Key Insights for Waste Connections, Inc. and Graco Inc.
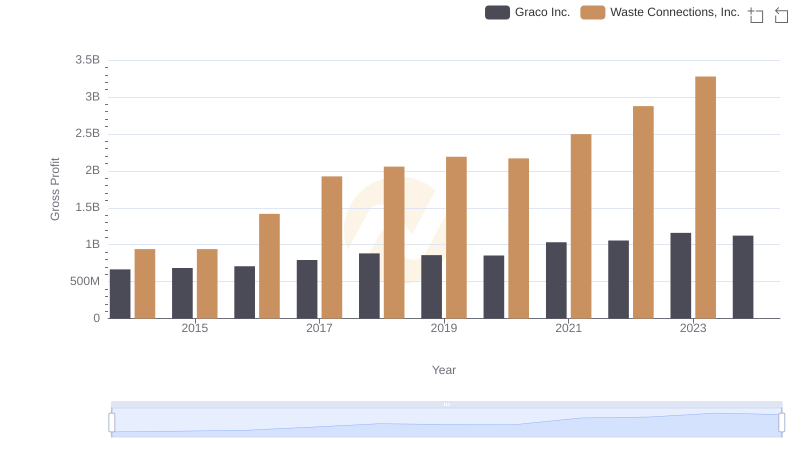
Waste Connections, Inc. vs Graco Inc.: A Gross Profit Performance Breakdown
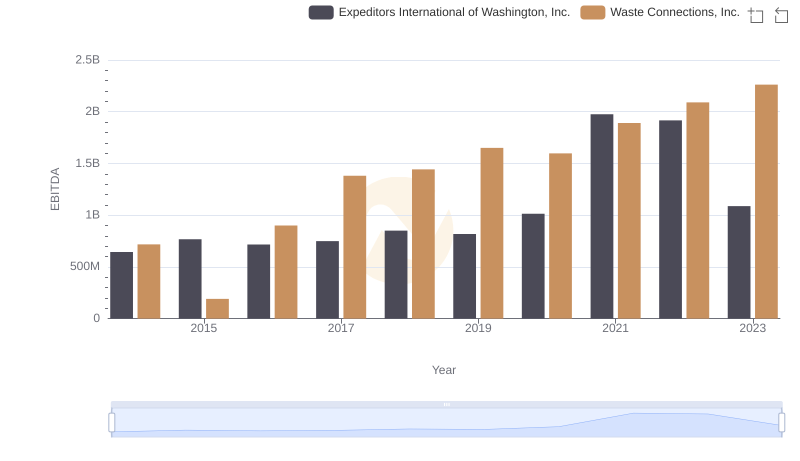
A Side-by-Side Analysis of EBITDA: Waste Connections, Inc. and Expeditors International of Washington, Inc.
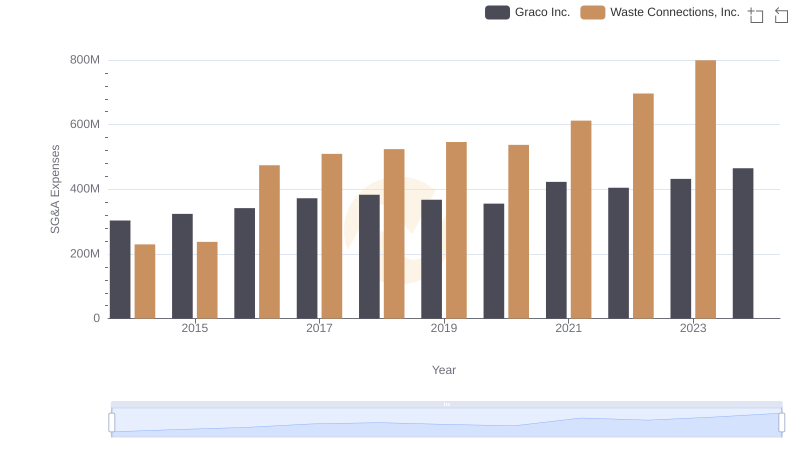
Operational Costs Compared: SG&A Analysis of Waste Connections, Inc. and Graco Inc.
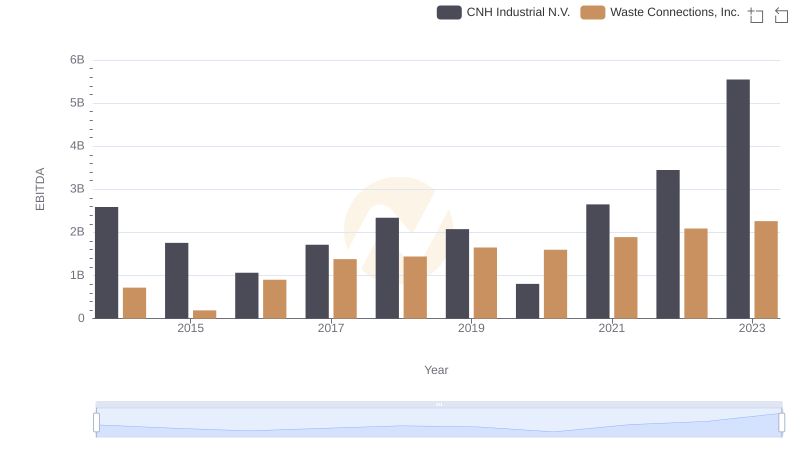
EBITDA Metrics Evaluated: Waste Connections, Inc. vs CNH Industrial N.V.
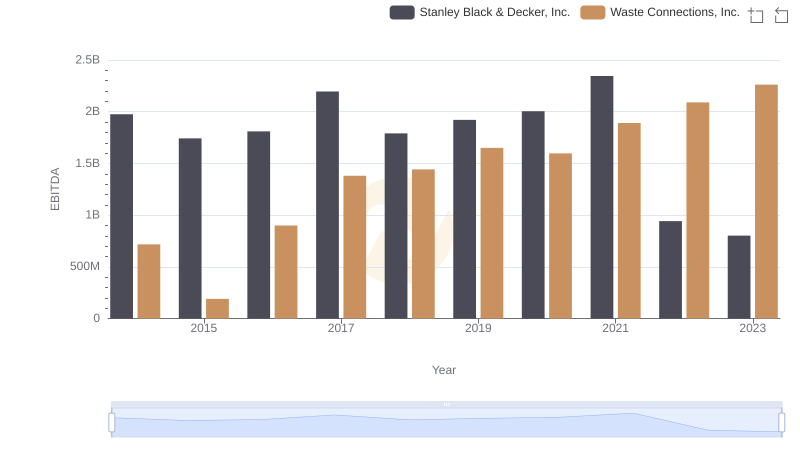
Professional EBITDA Benchmarking: Waste Connections, Inc. vs Stanley Black & Decker, Inc.
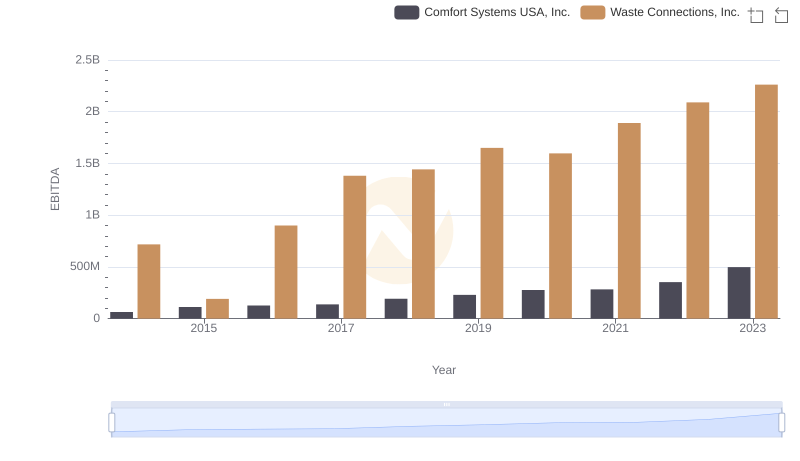
Waste Connections, Inc. vs Comfort Systems USA, Inc.: In-Depth EBITDA Performance Comparison
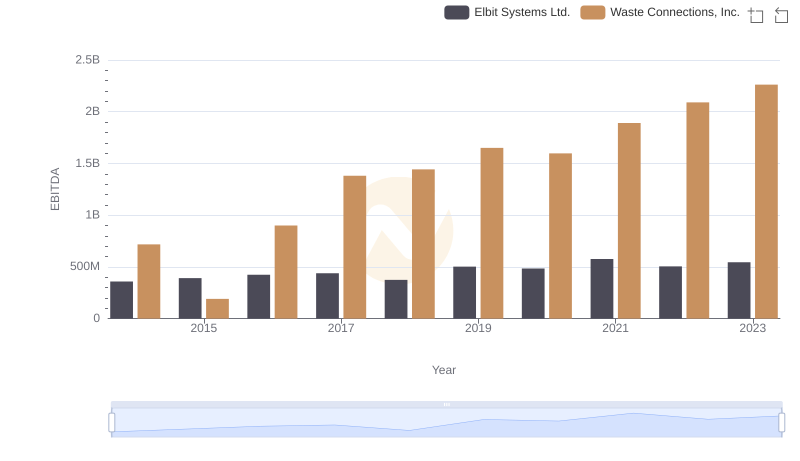
Comprehensive EBITDA Comparison: Waste Connections, Inc. vs Elbit Systems Ltd.
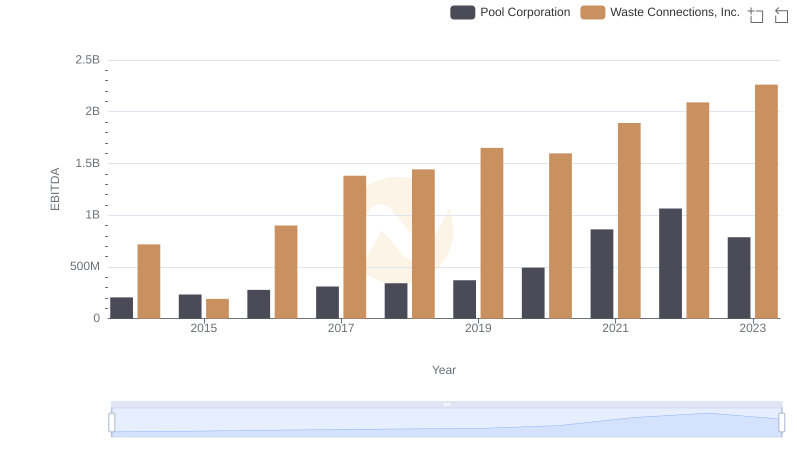
A Professional Review of EBITDA: Waste Connections, Inc. Compared to Pool Corporation
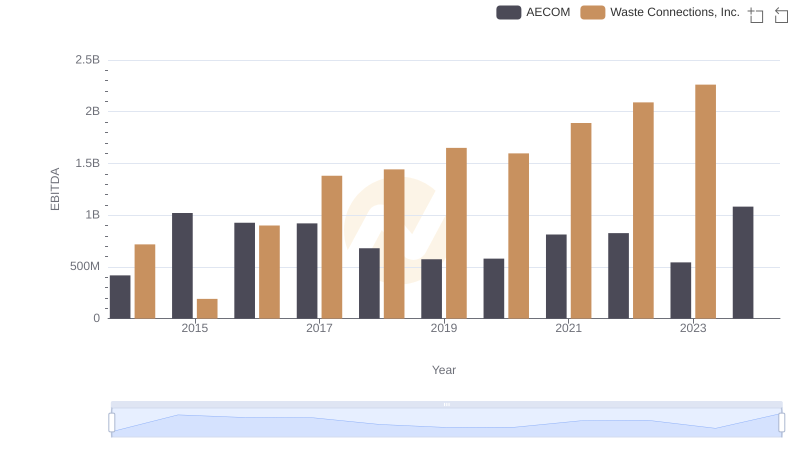
Professional EBITDA Benchmarking: Waste Connections, Inc. vs AECOM