| __timestamp | AECOM | Waste Connections, Inc. |
|---|---|---|
| Wednesday, January 1, 2014 | 417662000 | 717805000 |
| Thursday, January 1, 2015 | 1020478000 | 191002871 |
| Friday, January 1, 2016 | 926466000 | 900371894 |
| Sunday, January 1, 2017 | 920292000 | 1380632000 |
| Monday, January 1, 2018 | 680801000 | 1442229014 |
| Tuesday, January 1, 2019 | 573352000 | 1650754605 |
| Wednesday, January 1, 2020 | 580017000 | 1597555000 |
| Friday, January 1, 2021 | 813356000 | 1891001000 |
| Saturday, January 1, 2022 | 826856000 | 2090554149 |
| Sunday, January 1, 2023 | 543642000 | 2261354000 |
| Monday, January 1, 2024 | 1082384000 | 2389779000 |
Cracking the code
In the ever-evolving landscape of waste management and infrastructure services, Waste Connections, Inc. and AECOM have emerged as industry leaders. Over the past decade, Waste Connections, Inc. has consistently outperformed AECOM in terms of EBITDA, showcasing a robust growth trajectory. From 2014 to 2023, Waste Connections, Inc. saw its EBITDA grow by approximately 215%, peaking in 2023. In contrast, AECOM's EBITDA fluctuated, with a notable dip in 2023, reflecting a 33% decrease from its 2022 peak. This divergence highlights Waste Connections, Inc.'s strategic prowess in capitalizing on market opportunities, while AECOM faces challenges in maintaining its financial momentum. As we look to the future, the absence of 2024 data for Waste Connections, Inc. leaves room for speculation on its continued dominance. This analysis underscores the dynamic nature of the industry and the critical importance of strategic agility.

Waste Connections, Inc. and AECOM: A Detailed Gross Profit Analysis
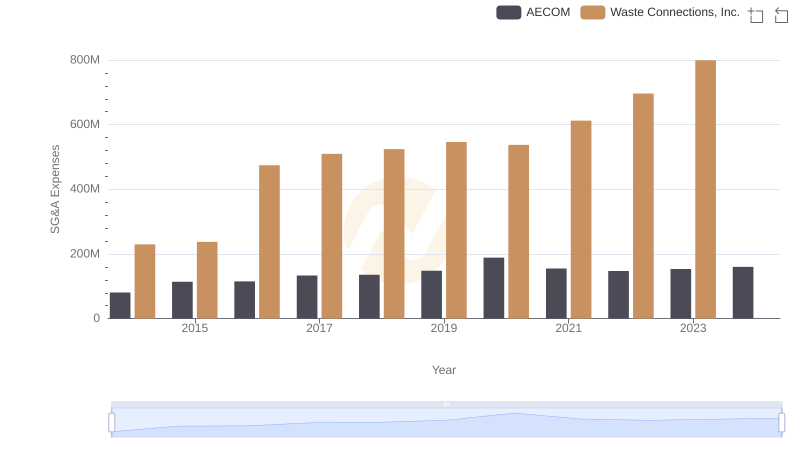
Comparing SG&A Expenses: Waste Connections, Inc. vs AECOM Trends and Insights
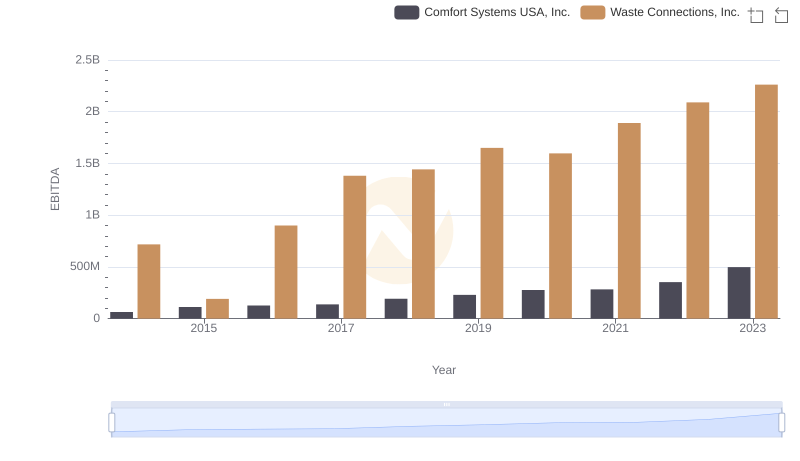
Waste Connections, Inc. vs Comfort Systems USA, Inc.: In-Depth EBITDA Performance Comparison
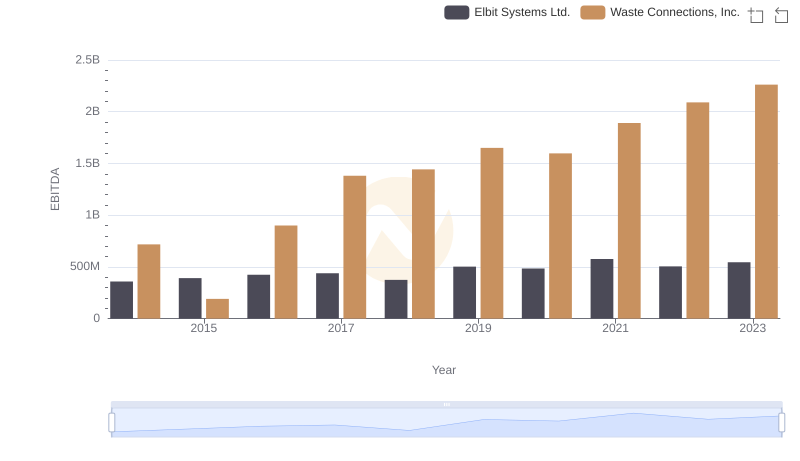
Comprehensive EBITDA Comparison: Waste Connections, Inc. vs Elbit Systems Ltd.
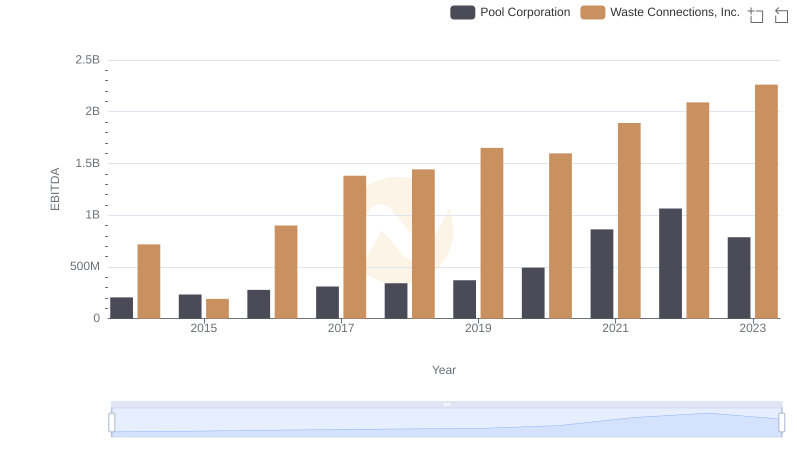
A Professional Review of EBITDA: Waste Connections, Inc. Compared to Pool Corporation
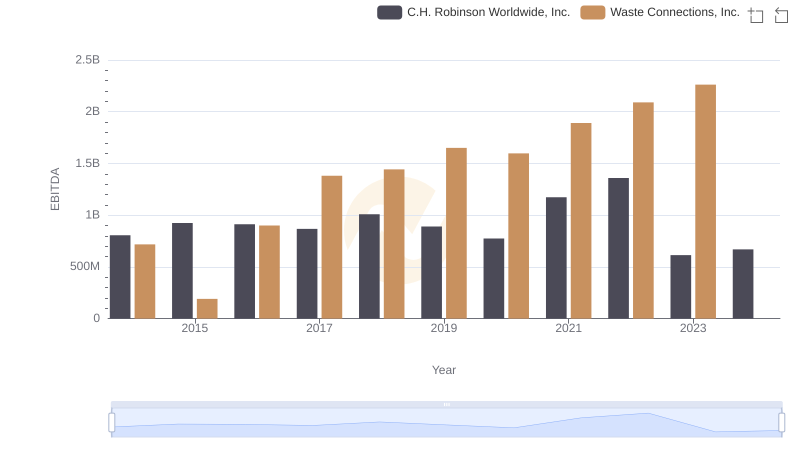
A Professional Review of EBITDA: Waste Connections, Inc. Compared to C.H. Robinson Worldwide, Inc.
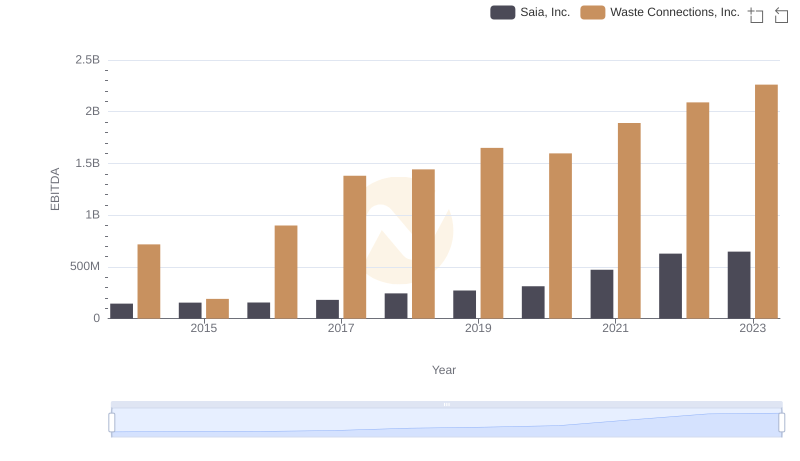
EBITDA Performance Review: Waste Connections, Inc. vs Saia, Inc.