| __timestamp | Stanley Black & Decker, Inc. | Waste Connections, Inc. |
|---|---|---|
| Wednesday, January 1, 2014 | 1975400000 | 717805000 |
| Thursday, January 1, 2015 | 1741900000 | 191002871 |
| Friday, January 1, 2016 | 1810200000 | 900371894 |
| Sunday, January 1, 2017 | 2196000000 | 1380632000 |
| Monday, January 1, 2018 | 1791200000 | 1442229014 |
| Tuesday, January 1, 2019 | 1920600000 | 1650754605 |
| Wednesday, January 1, 2020 | 2004200000 | 1597555000 |
| Friday, January 1, 2021 | 2345500000 | 1891001000 |
| Saturday, January 1, 2022 | 942800000 | 2090554149 |
| Sunday, January 1, 2023 | 802700000 | 2261354000 |
| Monday, January 1, 2024 | 286300000 | 2389779000 |
Unlocking the unknown
In the ever-evolving landscape of industrial giants, Waste Connections, Inc. and Stanley Black & Decker, Inc. have carved distinct paths. Over the past decade, Waste Connections has seen a remarkable 215% increase in EBITDA, reflecting its strategic growth and operational efficiency. In contrast, Stanley Black & Decker experienced a 59% decline in EBITDA from 2021 to 2023, highlighting challenges in maintaining its historical performance.
From 2014 to 2023, Waste Connections consistently outperformed, with EBITDA peaking in 2023 at over 2.26 billion. Meanwhile, Stanley Black & Decker's EBITDA peaked in 2021 but faced a downturn, dropping to 802 million by 2023. This divergence underscores the dynamic nature of the industrial sector, where adaptability and strategic foresight are key.
Explore the trends and insights that define these industry leaders and their financial journeys.
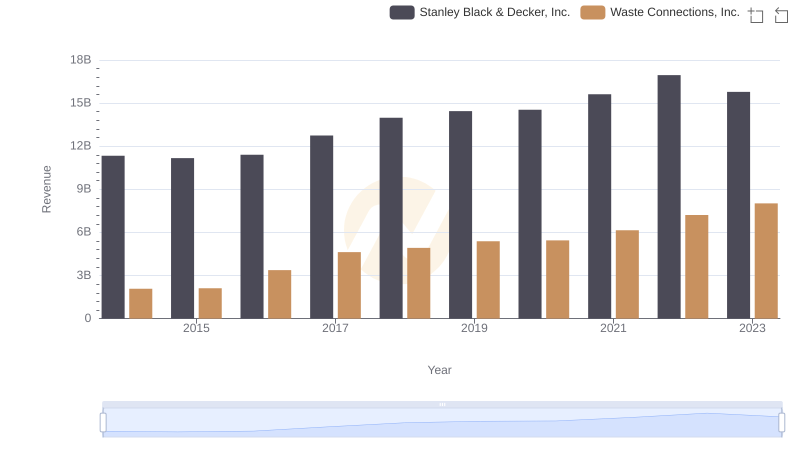
Comparing Revenue Performance: Waste Connections, Inc. or Stanley Black & Decker, Inc.?

Who Generates Higher Gross Profit? Waste Connections, Inc. or Stanley Black & Decker, Inc.
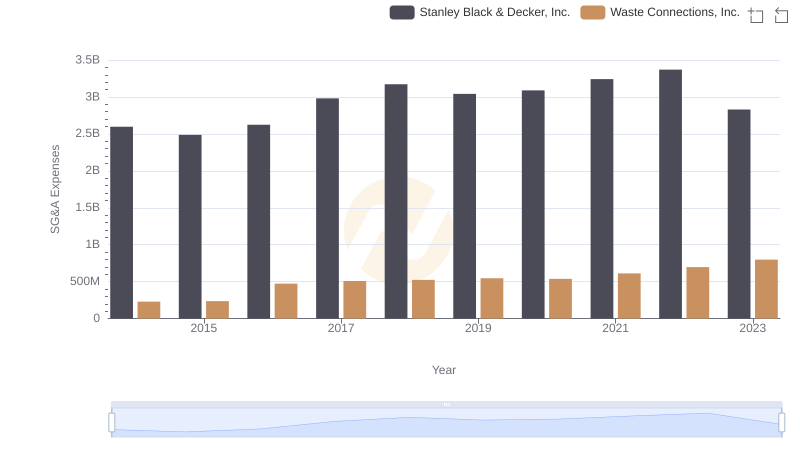
Breaking Down SG&A Expenses: Waste Connections, Inc. vs Stanley Black & Decker, Inc.
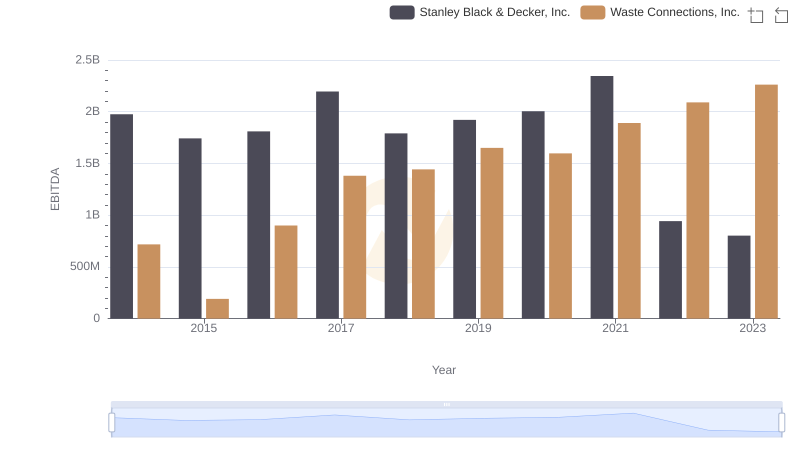
A Professional Review of EBITDA: Waste Connections, Inc. Compared to Stanley Black & Decker, Inc.
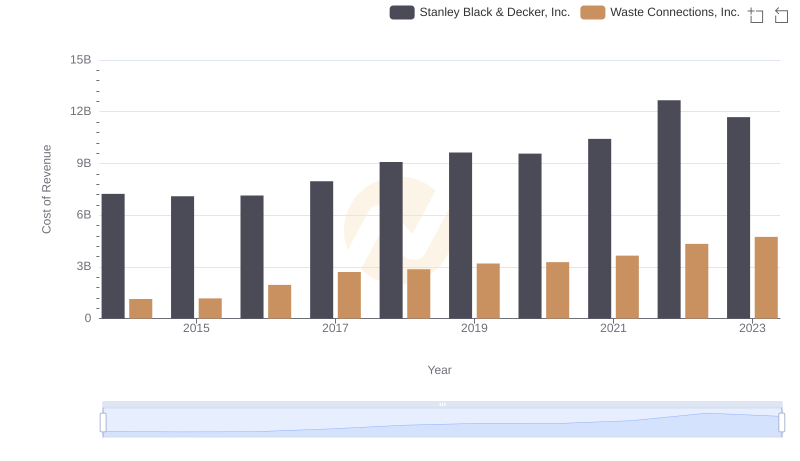
Cost Insights: Breaking Down Waste Connections, Inc. and Stanley Black & Decker, Inc.'s Expenses
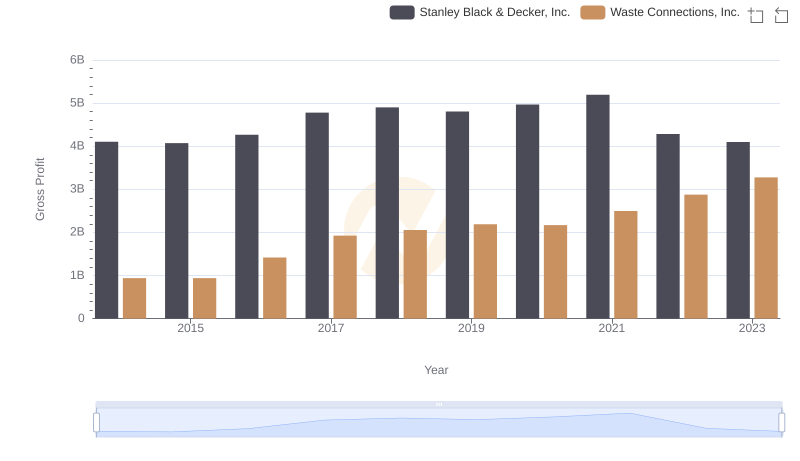
Gross Profit Analysis: Comparing Waste Connections, Inc. and Stanley Black & Decker, Inc.

Professional EBITDA Benchmarking: Waste Connections, Inc. vs Graco Inc.
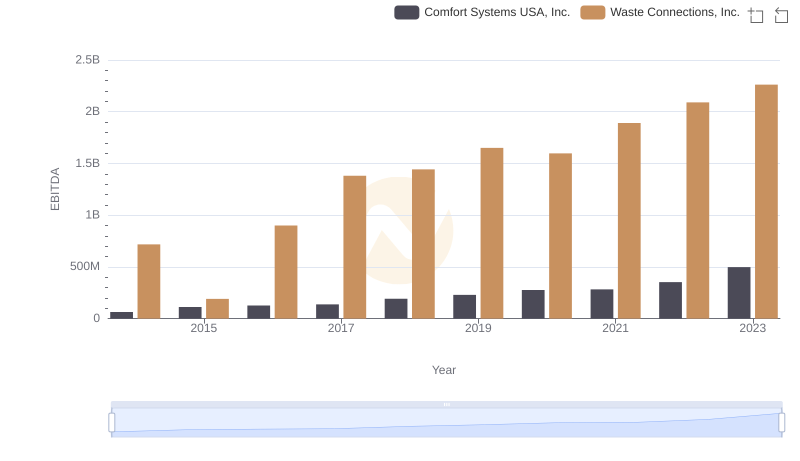
Waste Connections, Inc. vs Comfort Systems USA, Inc.: In-Depth EBITDA Performance Comparison
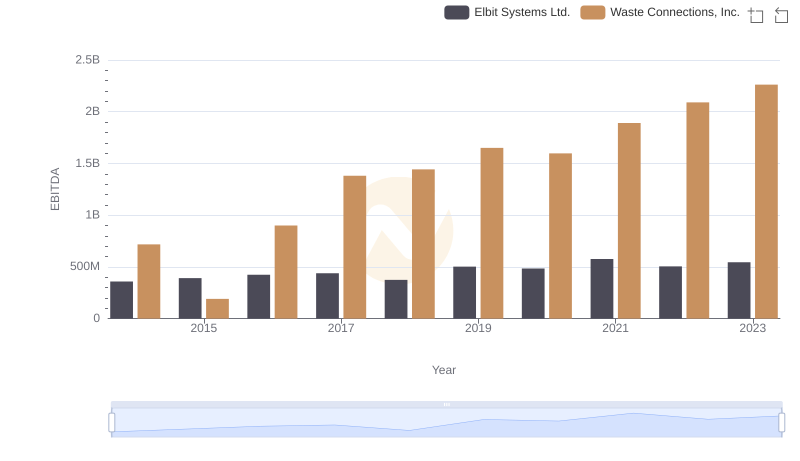
Comprehensive EBITDA Comparison: Waste Connections, Inc. vs Elbit Systems Ltd.