| __timestamp | Comfort Systems USA, Inc. | Waste Connections, Inc. |
|---|---|---|
| Wednesday, January 1, 2014 | 63455000 | 717805000 |
| Thursday, January 1, 2015 | 112580000 | 191002871 |
| Friday, January 1, 2016 | 126974000 | 900371894 |
| Sunday, January 1, 2017 | 137151000 | 1380632000 |
| Monday, January 1, 2018 | 191982000 | 1442229014 |
| Tuesday, January 1, 2019 | 229518000 | 1650754605 |
| Wednesday, January 1, 2020 | 276904000 | 1597555000 |
| Friday, January 1, 2021 | 282506000 | 1891001000 |
| Saturday, January 1, 2022 | 352446000 | 2090554149 |
| Sunday, January 1, 2023 | 497652000 | 2261354000 |
| Monday, January 1, 2024 | 2389779000 |
Unlocking the unknown
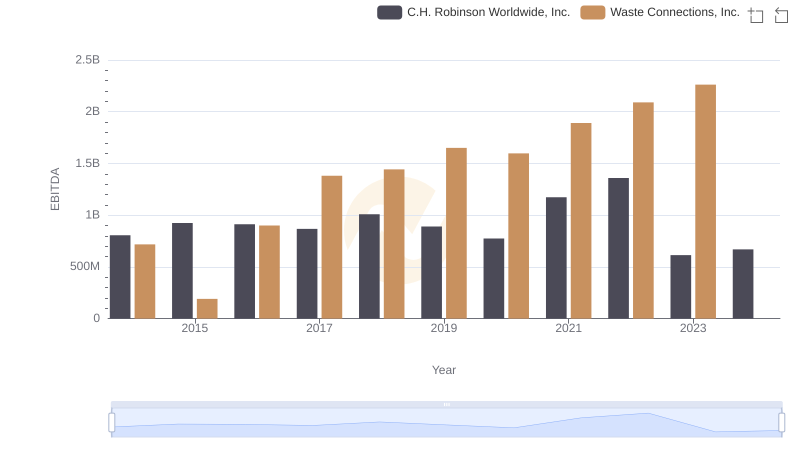
In the ever-evolving landscape of corporate performance, EBITDA serves as a crucial indicator of a company's financial health. From 2014 to 2023, Waste Connections, Inc. and Comfort Systems USA, Inc. have showcased contrasting trajectories in their EBITDA growth. Waste Connections, Inc. has consistently outperformed, with a staggering 215% increase over the decade, peaking at approximately $2.26 billion in 2023. In contrast, Comfort Systems USA, Inc. demonstrated a robust growth of 684%, reaching nearly $498 million in the same year. This comparison highlights Waste Connections' dominance in the waste management sector, while Comfort Systems USA, Inc. steadily strengthens its foothold in the mechanical services industry. As we delve into these figures, it becomes evident that strategic investments and market positioning have played pivotal roles in shaping these companies' financial narratives.
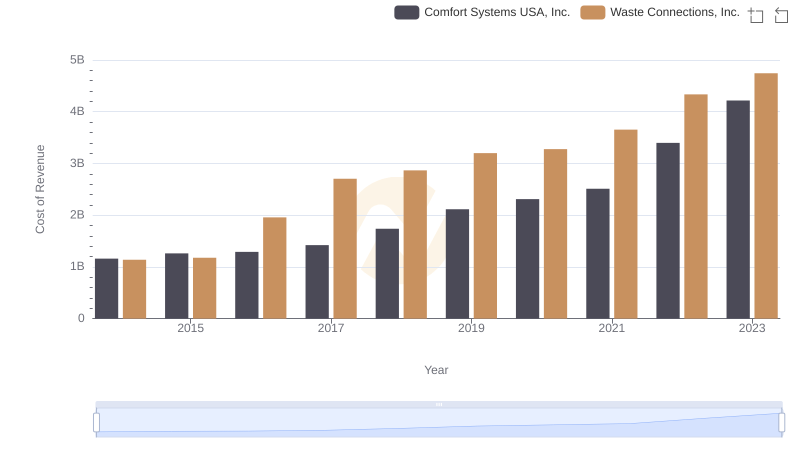
Cost of Revenue Comparison: Waste Connections, Inc. vs Comfort Systems USA, Inc.
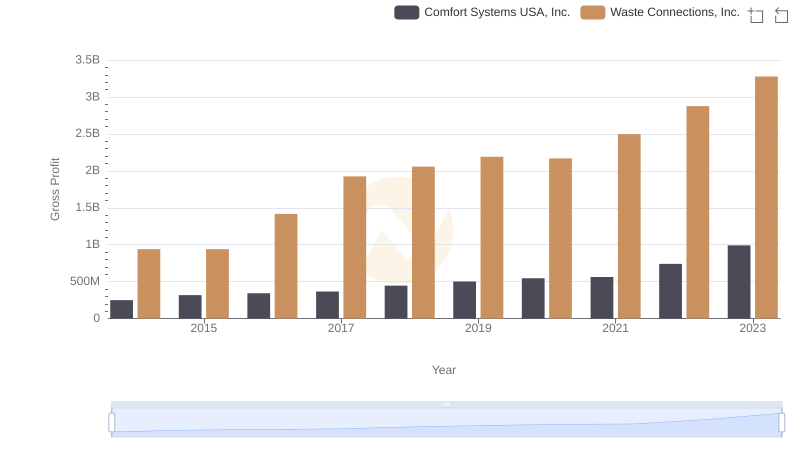
Gross Profit Trends Compared: Waste Connections, Inc. vs Comfort Systems USA, Inc.
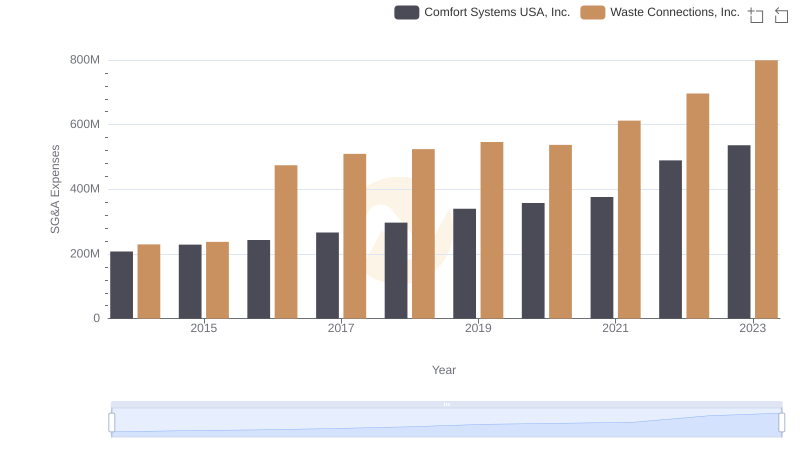
Operational Costs Compared: SG&A Analysis of Waste Connections, Inc. and Comfort Systems USA, Inc.
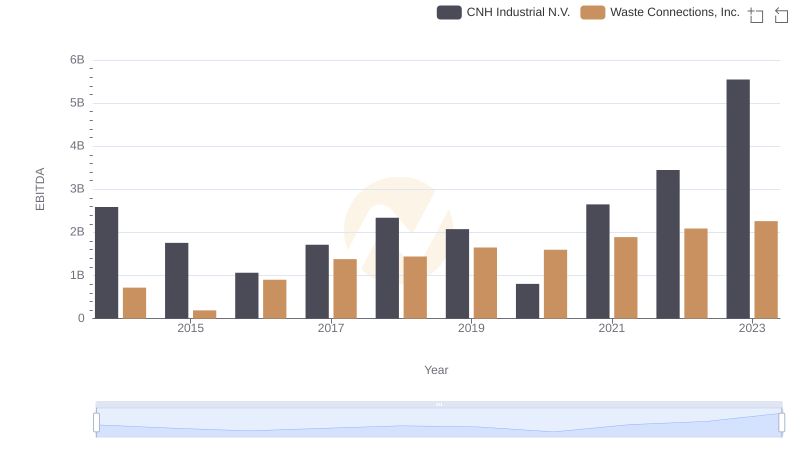
EBITDA Metrics Evaluated: Waste Connections, Inc. vs CNH Industrial N.V.

Professional EBITDA Benchmarking: Waste Connections, Inc. vs Graco Inc.
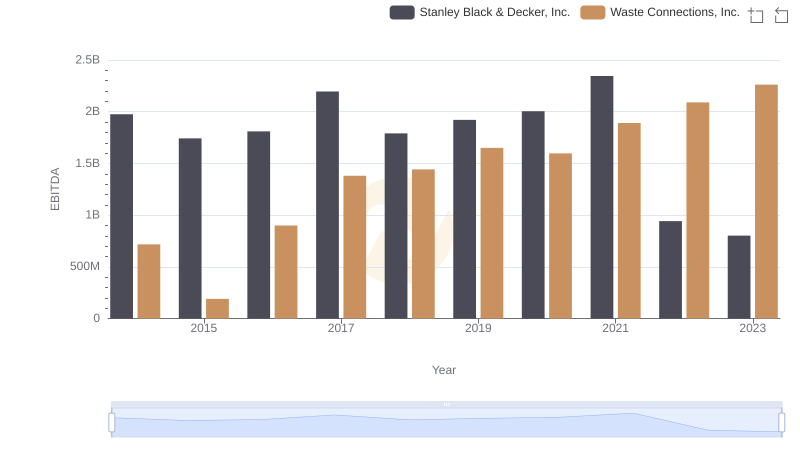
Professional EBITDA Benchmarking: Waste Connections, Inc. vs Stanley Black & Decker, Inc.
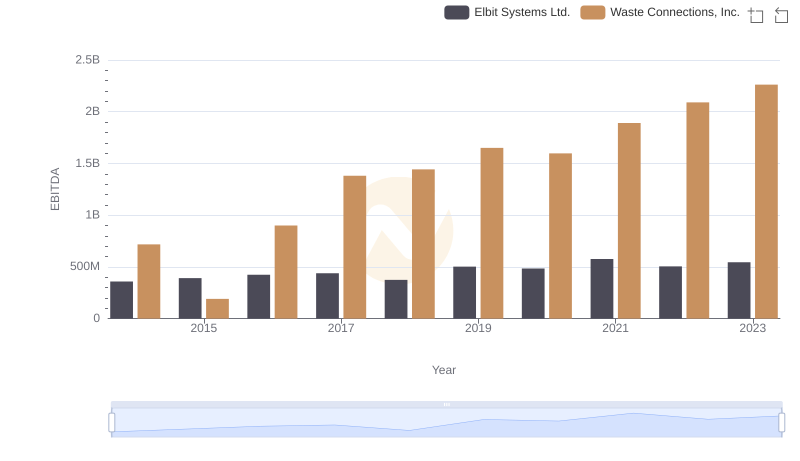
Comprehensive EBITDA Comparison: Waste Connections, Inc. vs Elbit Systems Ltd.
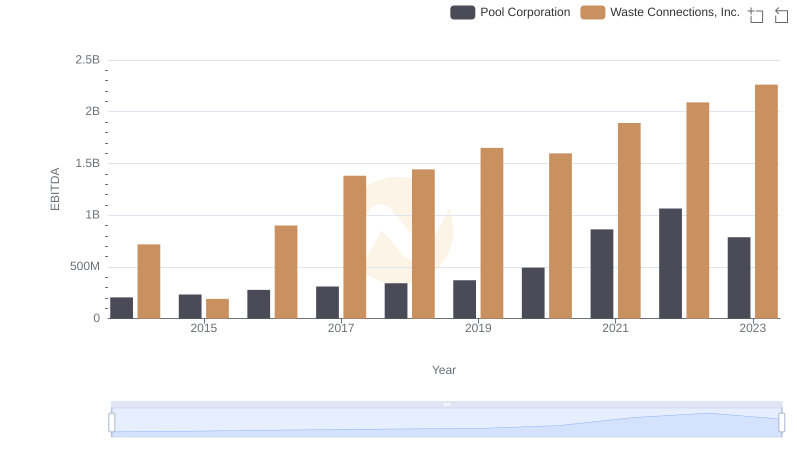
A Professional Review of EBITDA: Waste Connections, Inc. Compared to Pool Corporation
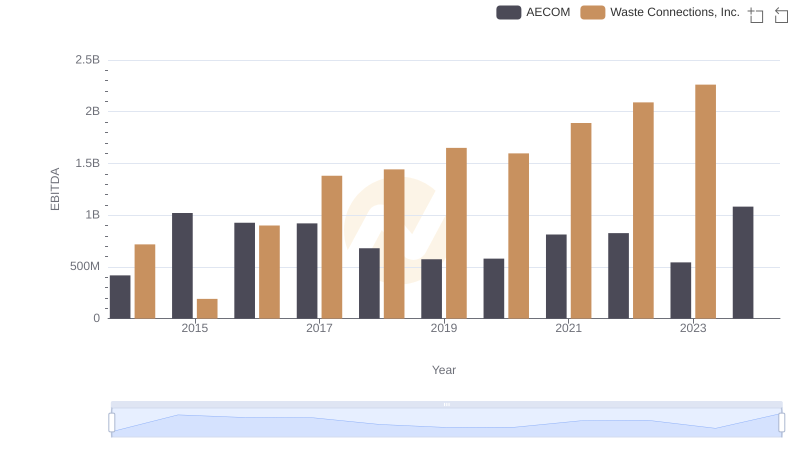
Professional EBITDA Benchmarking: Waste Connections, Inc. vs AECOM
A Professional Review of EBITDA: Waste Connections, Inc. Compared to C.H. Robinson Worldwide, Inc.