| __timestamp | Graco Inc. | Waste Connections, Inc. |
|---|---|---|
| Wednesday, January 1, 2014 | 303565000 | 229474000 |
| Thursday, January 1, 2015 | 324016000 | 237484000 |
| Friday, January 1, 2016 | 341734000 | 474263000 |
| Sunday, January 1, 2017 | 372496000 | 509638000 |
| Monday, January 1, 2018 | 382988000 | 524388000 |
| Tuesday, January 1, 2019 | 367743000 | 546278000 |
| Wednesday, January 1, 2020 | 355796000 | 537632000 |
| Friday, January 1, 2021 | 422975000 | 612337000 |
| Saturday, January 1, 2022 | 404731000 | 696467000 |
| Sunday, January 1, 2023 | 432156000 | 799119000 |
| Monday, January 1, 2024 | 465133000 | 883445000 |
Unlocking the unknown
In the ever-evolving landscape of corporate finance, understanding operational costs is crucial for stakeholders. This analysis delves into the Selling, General, and Administrative (SG&A) expenses of two industry giants: Waste Connections, Inc. and Graco Inc., from 2014 to 2023.
Over the past decade, Waste Connections, Inc. has seen a significant rise in SG&A expenses, peaking at approximately $799 million in 2023, marking a 248% increase from 2014. In contrast, Graco Inc. experienced a steadier growth, with expenses reaching around $465 million in 2024, a 53% increase from 2014.
This disparity highlights differing strategic approaches, with Waste Connections, Inc. potentially investing more aggressively in administrative and sales functions. Notably, data for 2024 is incomplete for Waste Connections, Inc., suggesting a need for cautious interpretation. Such insights are invaluable for investors and analysts seeking to understand cost management strategies in these corporations.
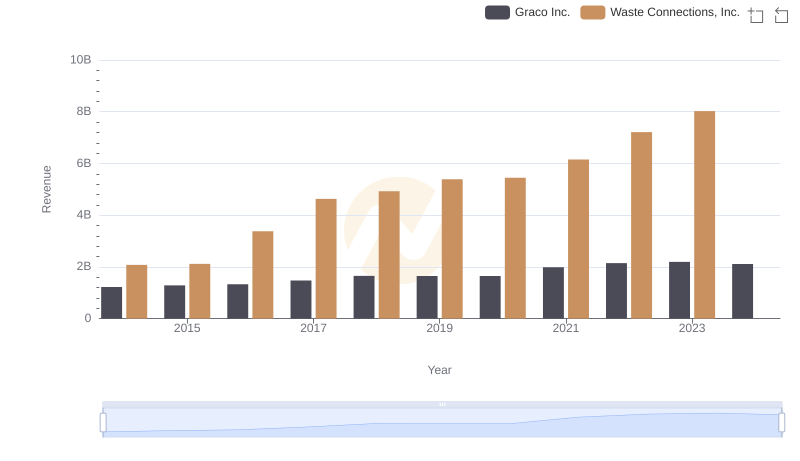
Annual Revenue Comparison: Waste Connections, Inc. vs Graco Inc.
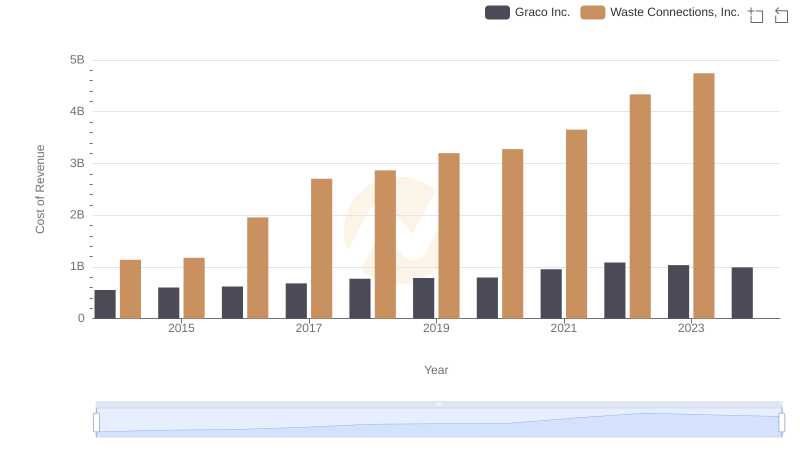
Cost of Revenue: Key Insights for Waste Connections, Inc. and Graco Inc.
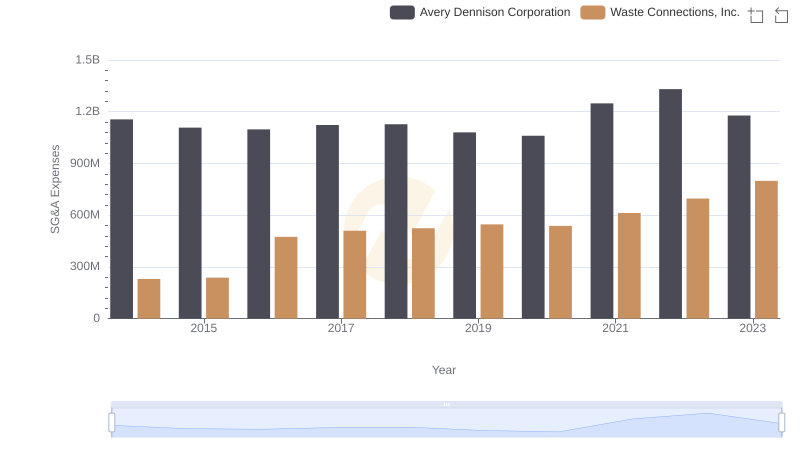
Breaking Down SG&A Expenses: Waste Connections, Inc. vs Avery Dennison Corporation
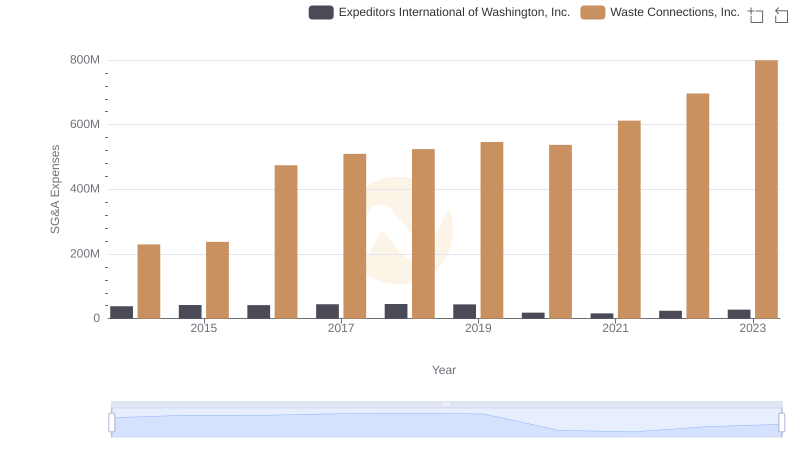
Breaking Down SG&A Expenses: Waste Connections, Inc. vs Expeditors International of Washington, Inc.
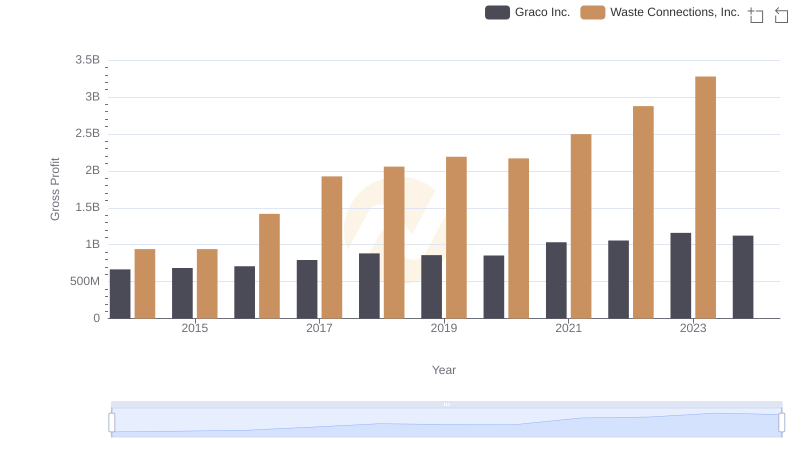
Waste Connections, Inc. vs Graco Inc.: A Gross Profit Performance Breakdown
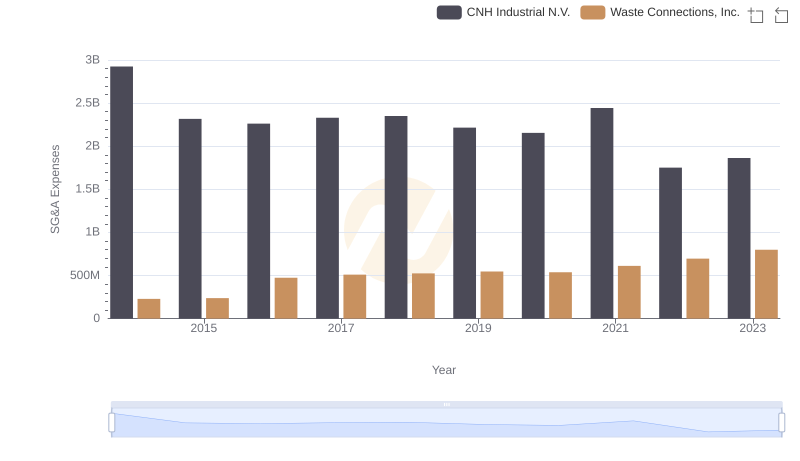
Waste Connections, Inc. vs CNH Industrial N.V.: SG&A Expense Trends
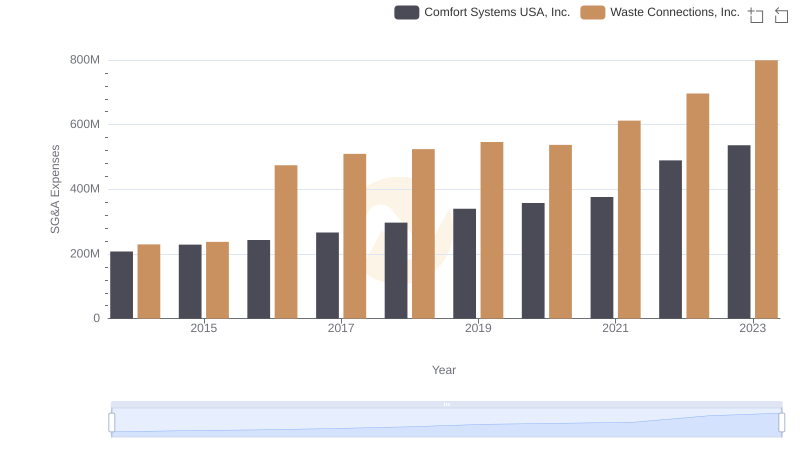
Operational Costs Compared: SG&A Analysis of Waste Connections, Inc. and Comfort Systems USA, Inc.

Professional EBITDA Benchmarking: Waste Connections, Inc. vs Graco Inc.
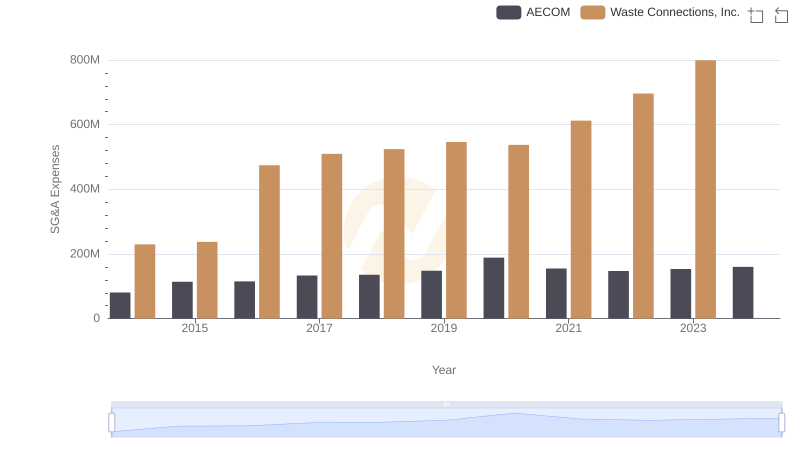
Comparing SG&A Expenses: Waste Connections, Inc. vs AECOM Trends and Insights
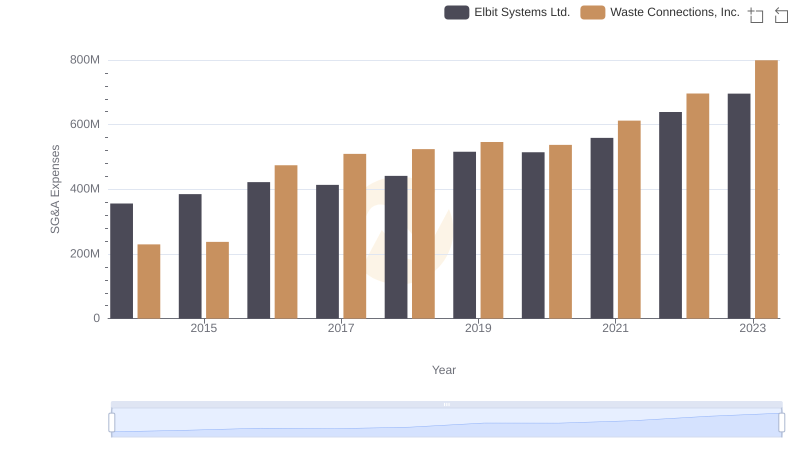
Waste Connections, Inc. and Elbit Systems Ltd.: SG&A Spending Patterns Compared