| __timestamp | Expeditors International of Washington, Inc. | Waste Connections, Inc. |
|---|---|---|
| Wednesday, January 1, 2014 | 643940000 | 717805000 |
| Thursday, January 1, 2015 | 767496000 | 191002871 |
| Friday, January 1, 2016 | 716959000 | 900371894 |
| Sunday, January 1, 2017 | 749570000 | 1380632000 |
| Monday, January 1, 2018 | 850582000 | 1442229014 |
| Tuesday, January 1, 2019 | 817642000 | 1650754605 |
| Wednesday, January 1, 2020 | 1013523000 | 1597555000 |
| Friday, January 1, 2021 | 1975928000 | 1891001000 |
| Saturday, January 1, 2022 | 1916506000 | 2090554149 |
| Sunday, January 1, 2023 | 1087588000 | 2261354000 |
| Monday, January 1, 2024 | 1154330000 | 2389779000 |
Infusing magic into the data realm
In the ever-evolving landscape of the logistics and waste management sectors, Waste Connections, Inc. and Expeditors International of Washington, Inc. have demonstrated remarkable EBITDA growth over the past decade. From 2014 to 2023, Waste Connections saw its EBITDA surge by approximately 215%, peaking at over 2.26 billion in 2023. This growth underscores the company's strategic expansions and operational efficiencies.
Conversely, Expeditors International experienced a more modest, yet significant, 69% increase in EBITDA during the same period, reaching its zenith in 2021 with nearly 2 billion. This reflects the company's resilience and adaptability in the face of global supply chain challenges.
The data highlights a compelling narrative of two industry leaders navigating their respective markets with distinct strategies, offering valuable insights into their financial trajectories and market positioning.
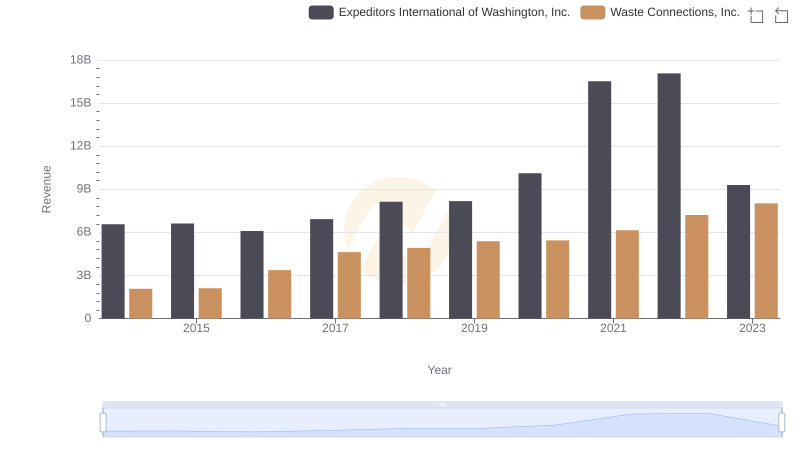
Waste Connections, Inc. or Expeditors International of Washington, Inc.: Who Leads in Yearly Revenue?

Analyzing Cost of Revenue: Waste Connections, Inc. and Expeditors International of Washington, Inc.
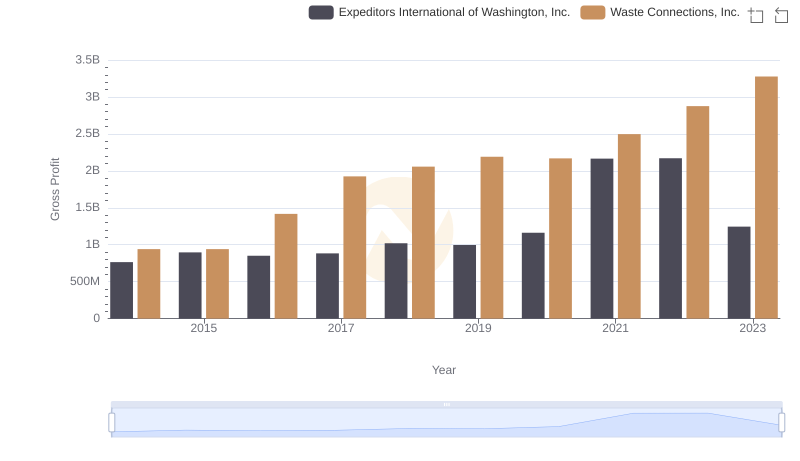
Gross Profit Trends Compared: Waste Connections, Inc. vs Expeditors International of Washington, Inc.
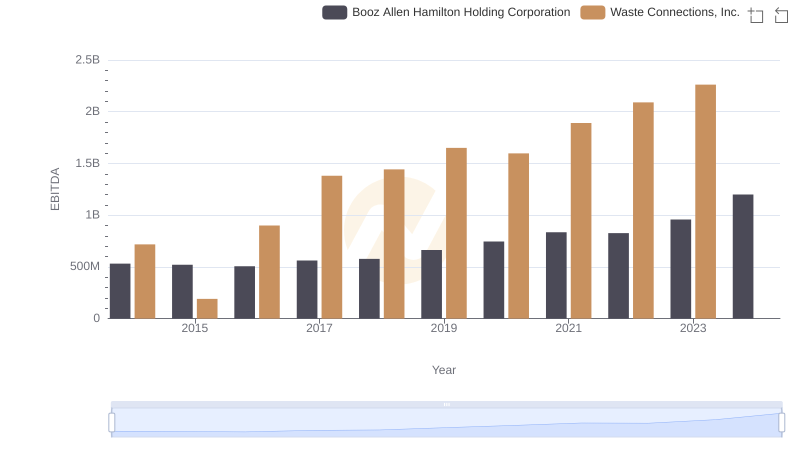
EBITDA Analysis: Evaluating Waste Connections, Inc. Against Booz Allen Hamilton Holding Corporation
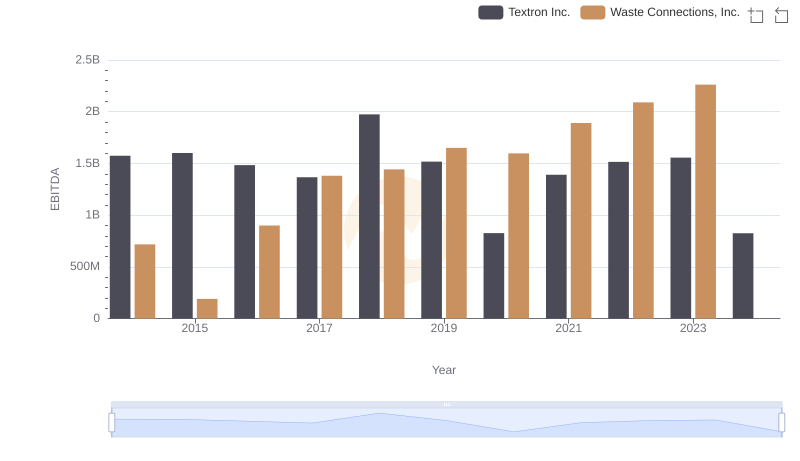
Waste Connections, Inc. and Textron Inc.: A Detailed Examination of EBITDA Performance
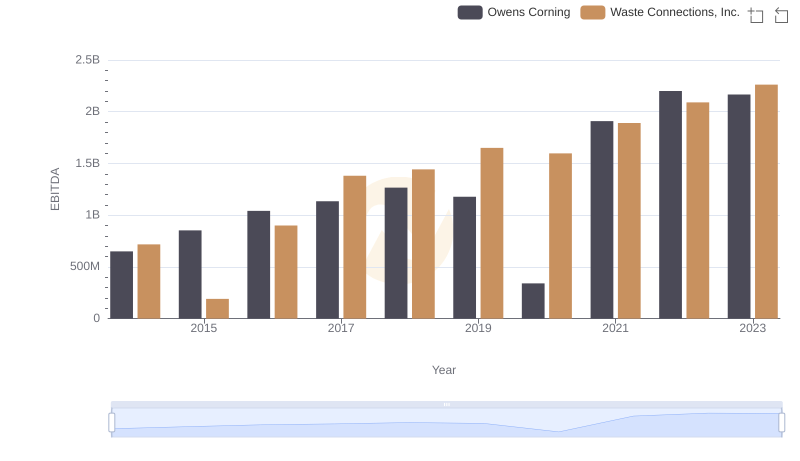
EBITDA Metrics Evaluated: Waste Connections, Inc. vs Owens Corning
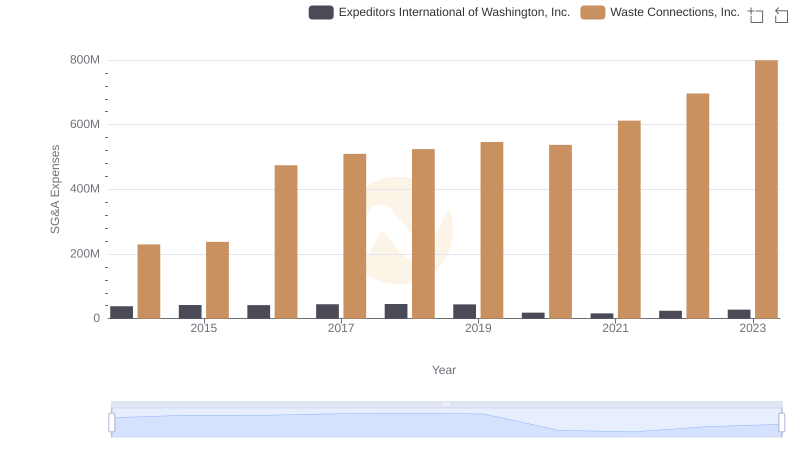
Breaking Down SG&A Expenses: Waste Connections, Inc. vs Expeditors International of Washington, Inc.
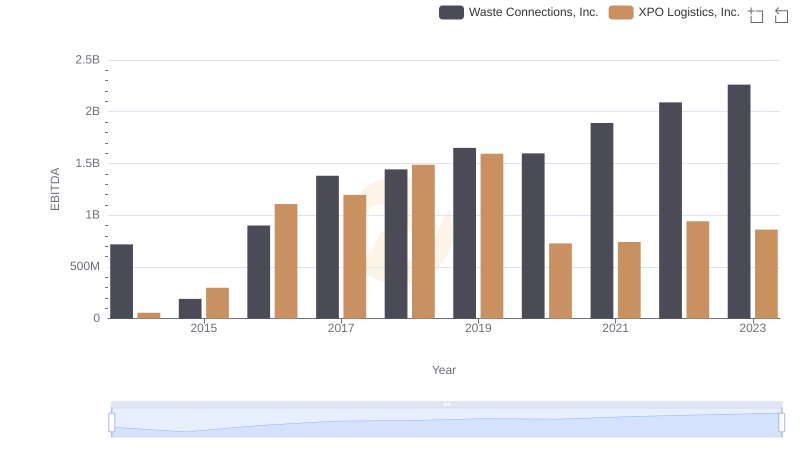
Comprehensive EBITDA Comparison: Waste Connections, Inc. vs XPO Logistics, Inc.
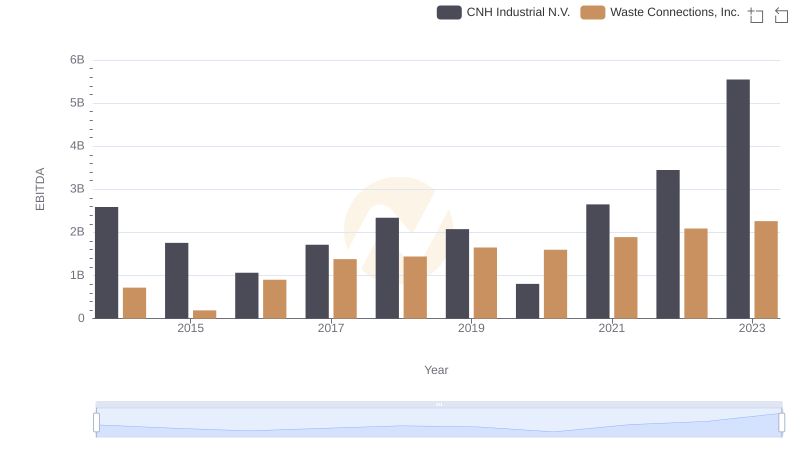
EBITDA Metrics Evaluated: Waste Connections, Inc. vs CNH Industrial N.V.

Professional EBITDA Benchmarking: Waste Connections, Inc. vs Graco Inc.