| __timestamp | Graco Inc. | Waste Connections, Inc. |
|---|---|---|
| Wednesday, January 1, 2014 | 1221130000 | 2079166000 |
| Thursday, January 1, 2015 | 1286485000 | 2117287000 |
| Friday, January 1, 2016 | 1329293000 | 3375863000 |
| Sunday, January 1, 2017 | 1474744000 | 4630488000 |
| Monday, January 1, 2018 | 1653292000 | 4922941000 |
| Tuesday, January 1, 2019 | 1646045000 | 5388679000 |
| Wednesday, January 1, 2020 | 1650115000 | 5445990000 |
| Friday, January 1, 2021 | 1987608000 | 6151361000 |
| Saturday, January 1, 2022 | 2143521000 | 7211859000 |
| Sunday, January 1, 2023 | 2195606000 | 8021951000 |
| Monday, January 1, 2024 | 2113316000 | 8919591000 |
Cracking the code
In the ever-evolving landscape of industrial services, Waste Connections, Inc. and Graco Inc. have emerged as formidable players. Over the past decade, Waste Connections has demonstrated a robust growth trajectory, with its revenue surging by nearly 286% from 2014 to 2023. This impressive rise underscores its strategic expansions and acquisitions in the waste management sector. Meanwhile, Graco Inc., a leader in fluid handling systems, has seen a steady revenue increase of approximately 80% during the same period, reflecting its innovation-driven approach.
By 2023, Waste Connections' revenue reached a remarkable 8 billion, dwarfing Graco's 2.2 billion. This stark contrast highlights the differing scales and market dynamics of the two companies. However, the data for 2024 remains incomplete, leaving room for speculation on future trends. As these industry giants continue to evolve, their financial journeys offer valuable insights into the broader economic landscape.
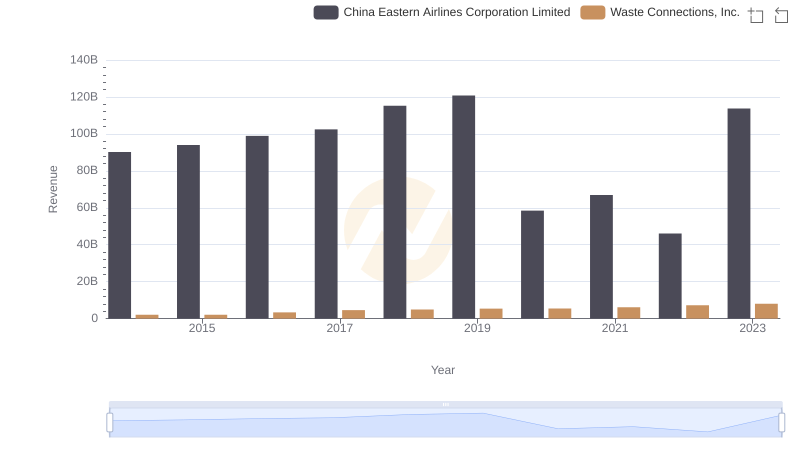
Revenue Insights: Waste Connections, Inc. and China Eastern Airlines Corporation Limited Performance Compared
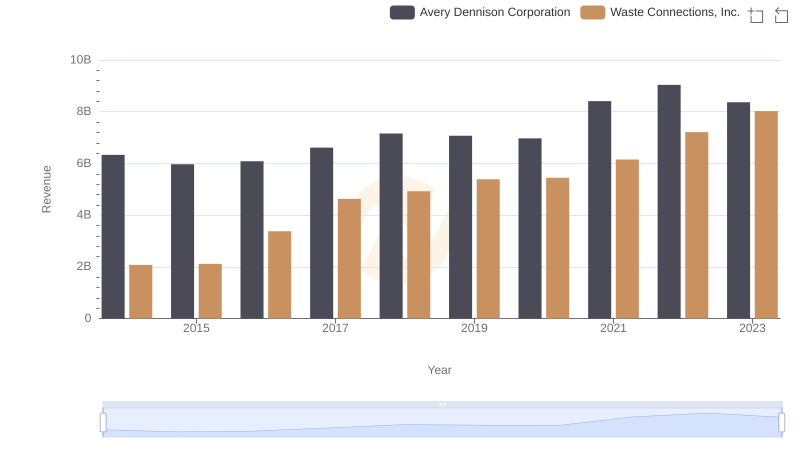
Waste Connections, Inc. vs Avery Dennison Corporation: Annual Revenue Growth Compared
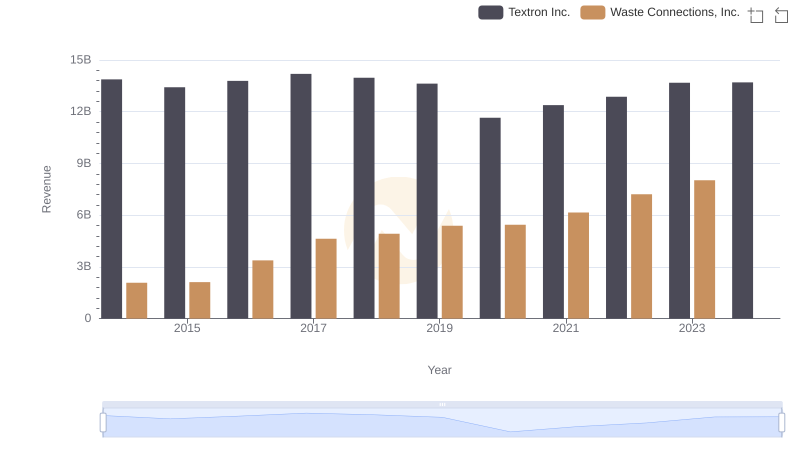
Waste Connections, Inc. and Textron Inc.: A Comprehensive Revenue Analysis
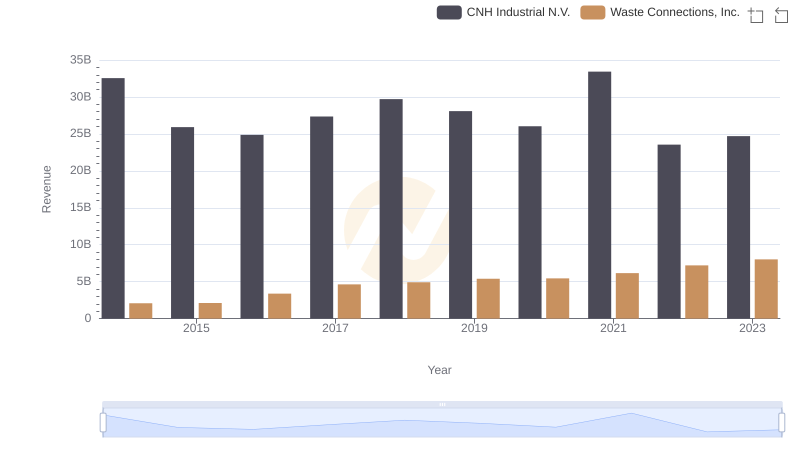
Revenue Showdown: Waste Connections, Inc. vs CNH Industrial N.V.
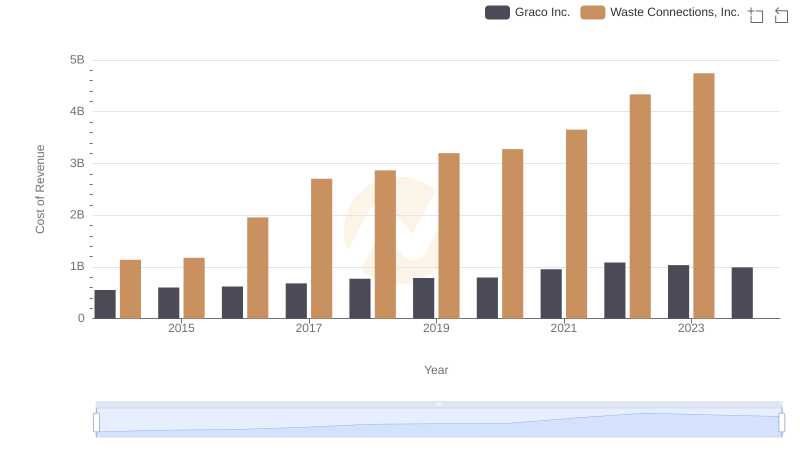
Cost of Revenue: Key Insights for Waste Connections, Inc. and Graco Inc.
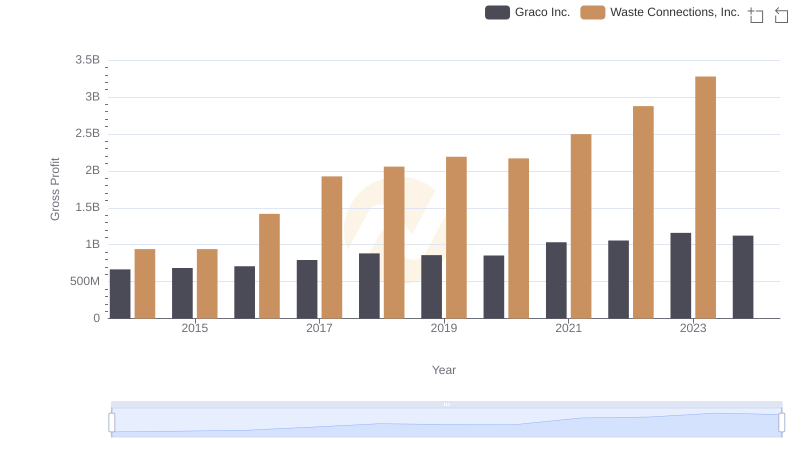
Waste Connections, Inc. vs Graco Inc.: A Gross Profit Performance Breakdown
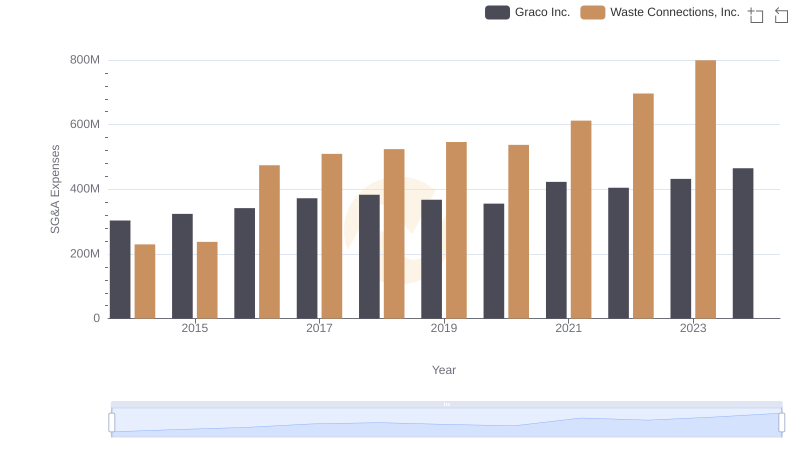
Operational Costs Compared: SG&A Analysis of Waste Connections, Inc. and Graco Inc.

Professional EBITDA Benchmarking: Waste Connections, Inc. vs Graco Inc.