| __timestamp | Graco Inc. | Waste Connections, Inc. |
|---|---|---|
| Wednesday, January 1, 2014 | 554394000 | 1138388000 |
| Thursday, January 1, 2015 | 601785000 | 1177409000 |
| Friday, January 1, 2016 | 621054000 | 1957712000 |
| Sunday, January 1, 2017 | 681695000 | 2704775000 |
| Monday, January 1, 2018 | 770753000 | 2865704000 |
| Tuesday, January 1, 2019 | 786289000 | 3198757000 |
| Wednesday, January 1, 2020 | 795178000 | 3276808000 |
| Friday, January 1, 2021 | 953659000 | 3654074000 |
| Saturday, January 1, 2022 | 1086082000 | 4336012000 |
| Sunday, January 1, 2023 | 1034585000 | 4744513000 |
| Monday, January 1, 2024 | 990855000 | 5191706000 |
Unleashing insights
In the ever-evolving landscape of industrial services and manufacturing, understanding cost dynamics is crucial. Waste Connections, Inc. and Graco Inc. have shown distinct trends in their cost of revenue from 2014 to 2023. Waste Connections, Inc. has seen a remarkable increase of over 300% in its cost of revenue, peaking in 2023. This growth reflects the company's expanding operations and market reach. In contrast, Graco Inc. experienced a steady rise, with a notable 86% increase over the same period, indicating consistent growth in its manufacturing processes.
Interestingly, 2023 marks a year of missing data for Waste Connections, Inc., suggesting potential shifts or reporting changes. These insights highlight the importance of cost management in maintaining competitive advantage. As we look to the future, monitoring these trends will be key for stakeholders aiming to navigate the complexities of these industries.
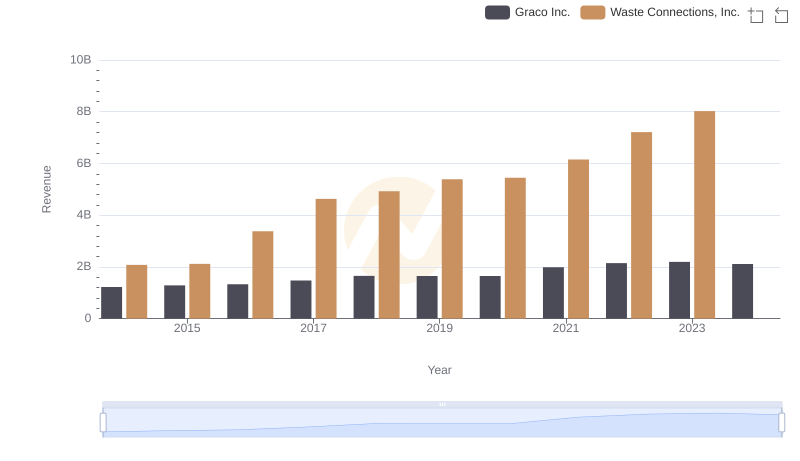
Annual Revenue Comparison: Waste Connections, Inc. vs Graco Inc.
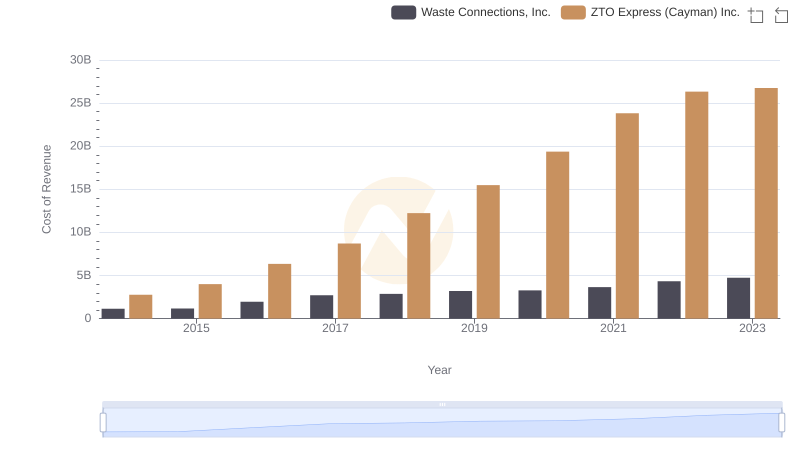
Cost Insights: Breaking Down Waste Connections, Inc. and ZTO Express (Cayman) Inc.'s Expenses
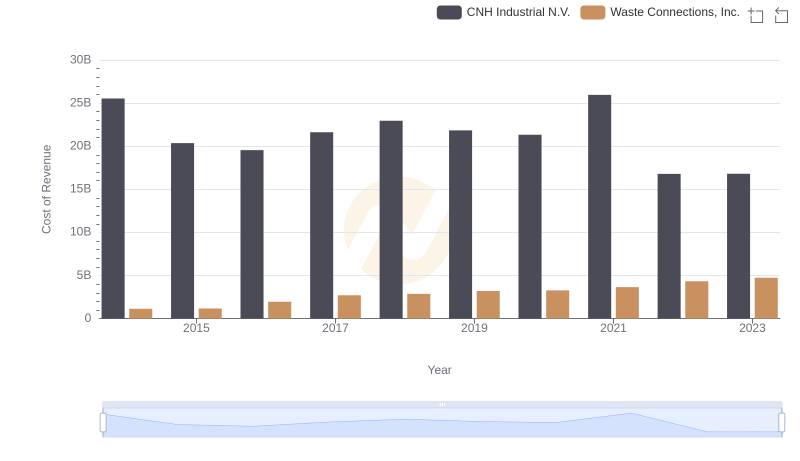
Cost Insights: Breaking Down Waste Connections, Inc. and CNH Industrial N.V.'s Expenses
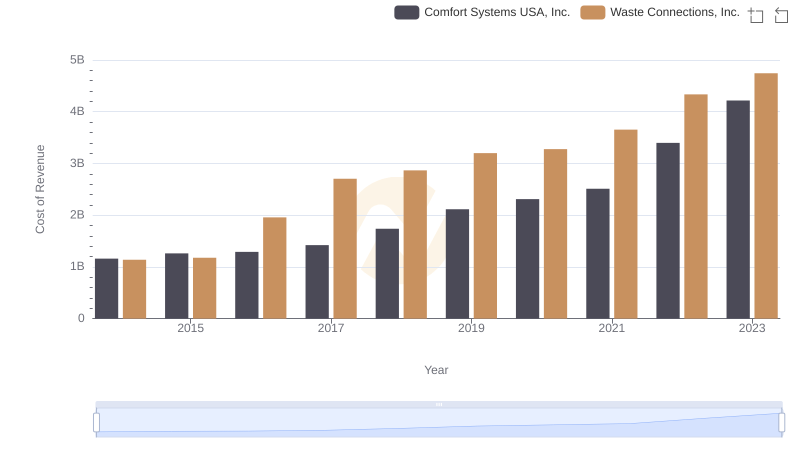
Cost of Revenue Comparison: Waste Connections, Inc. vs Comfort Systems USA, Inc.
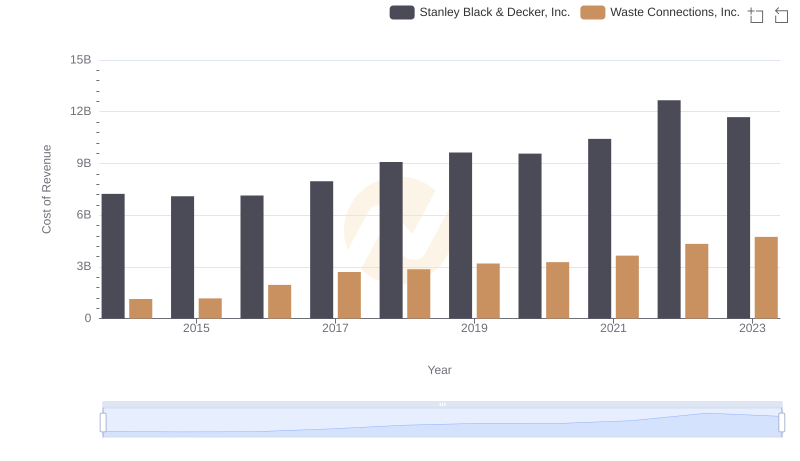
Cost Insights: Breaking Down Waste Connections, Inc. and Stanley Black & Decker, Inc.'s Expenses
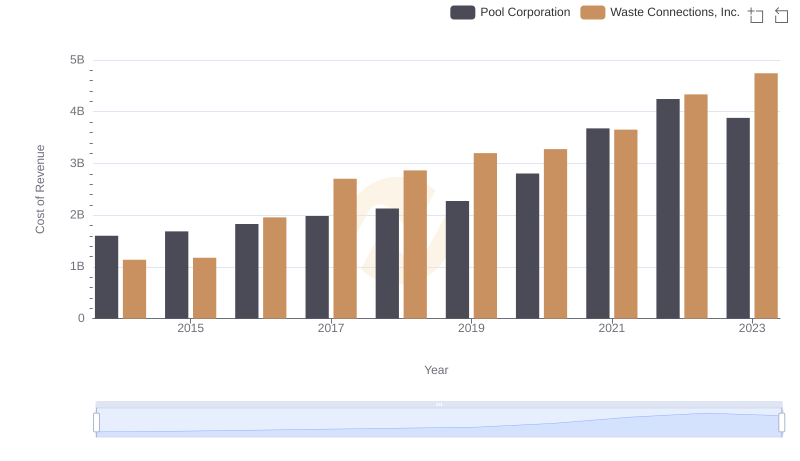
Waste Connections, Inc. vs Pool Corporation: Efficiency in Cost of Revenue Explored
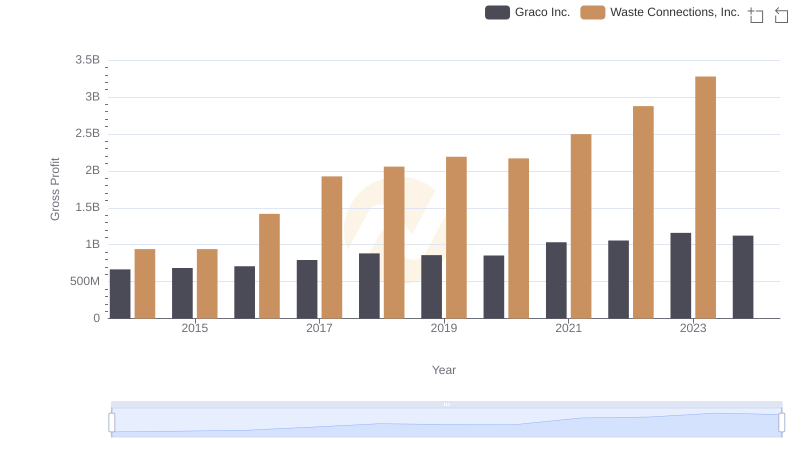
Waste Connections, Inc. vs Graco Inc.: A Gross Profit Performance Breakdown
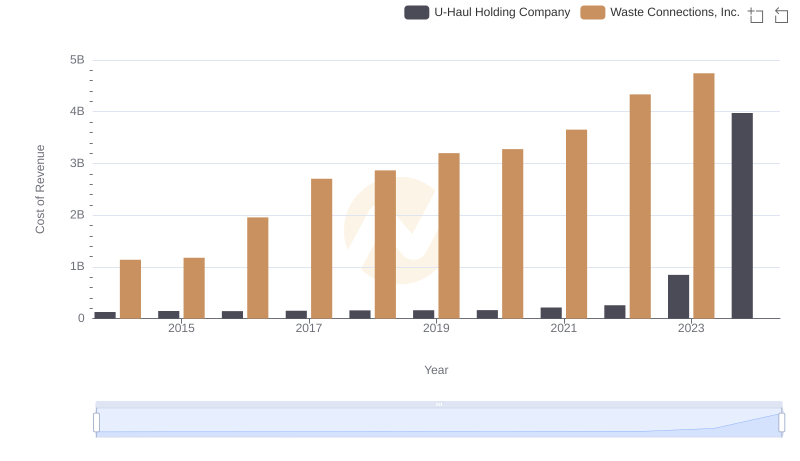
Cost of Revenue Trends: Waste Connections, Inc. vs U-Haul Holding Company
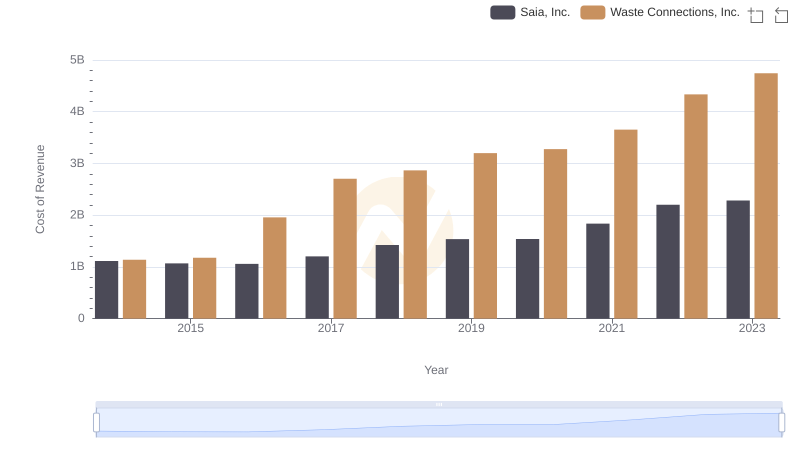
Cost Insights: Breaking Down Waste Connections, Inc. and Saia, Inc.'s Expenses
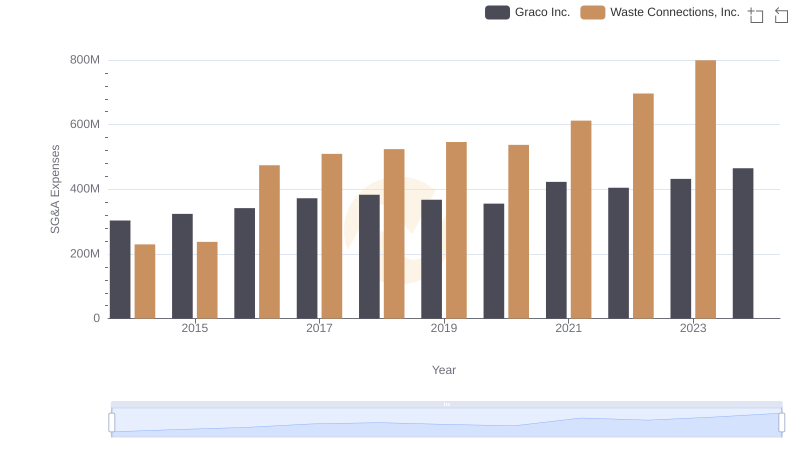
Operational Costs Compared: SG&A Analysis of Waste Connections, Inc. and Graco Inc.

Professional EBITDA Benchmarking: Waste Connections, Inc. vs Graco Inc.