| __timestamp | EMCOR Group, Inc. | Pool Corporation |
|---|---|---|
| Wednesday, January 1, 2014 | 6424965000 | 2246562000 |
| Thursday, January 1, 2015 | 6718726000 | 2363139000 |
| Friday, January 1, 2016 | 7551524000 | 2570803000 |
| Sunday, January 1, 2017 | 7686999000 | 2788188000 |
| Monday, January 1, 2018 | 8130631000 | 2998097000 |
| Tuesday, January 1, 2019 | 9174611000 | 3199517000 |
| Wednesday, January 1, 2020 | 8797061000 | 3936623000 |
| Friday, January 1, 2021 | 9903580000 | 5295584000 |
| Saturday, January 1, 2022 | 11076120000 | 6179727000 |
| Sunday, January 1, 2023 | 12582873000 | 5541595000 |
Igniting the spark of knowledge
In the ever-evolving landscape of the construction and services industry, EMCOR Group, Inc. and Pool Corporation have emerged as formidable players. Over the past decade, EMCOR has consistently outpaced Pool Corporation in annual revenue, showcasing a robust growth trajectory. From 2014 to 2023, EMCOR's revenue surged by approximately 96%, reaching a peak in 2023. In contrast, Pool Corporation experienced a commendable 147% increase, although its revenue remained lower than EMCOR's throughout the period.
This comparison highlights the dynamic nature of the industry and the strategic maneuvers by these companies to capture market share.
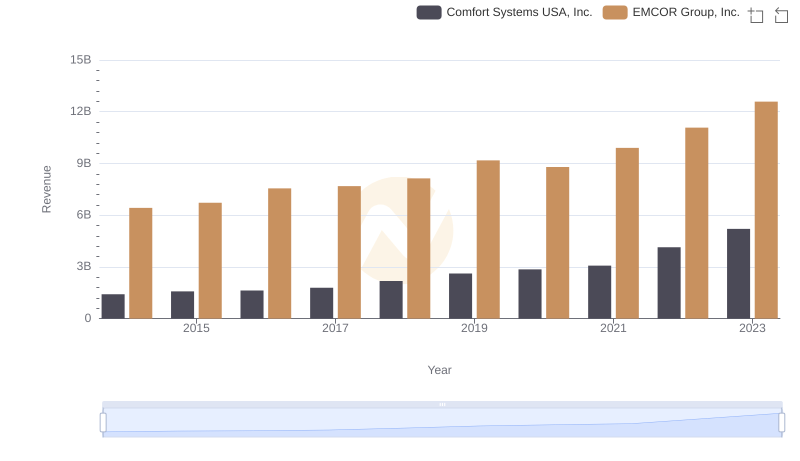
EMCOR Group, Inc. vs Comfort Systems USA, Inc.: Examining Key Revenue Metrics
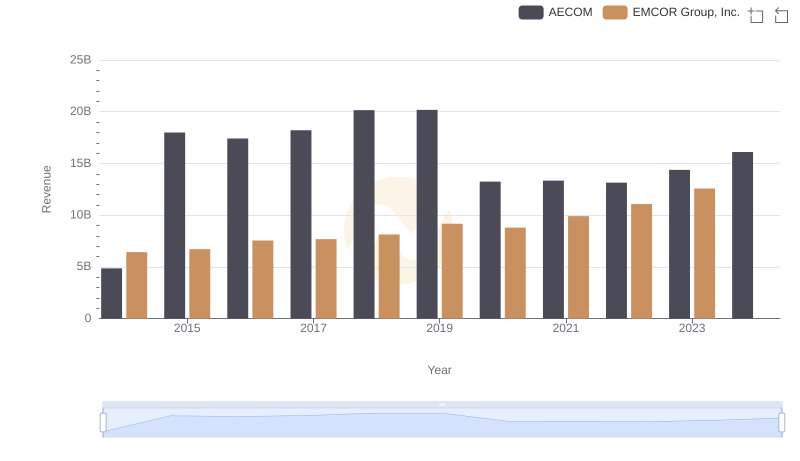
Revenue Insights: EMCOR Group, Inc. and AECOM Performance Compared
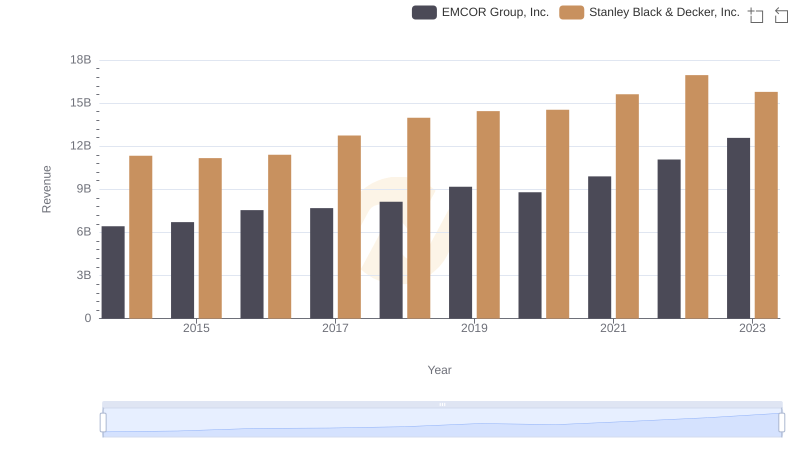
EMCOR Group, Inc. or Stanley Black & Decker, Inc.: Who Leads in Yearly Revenue?
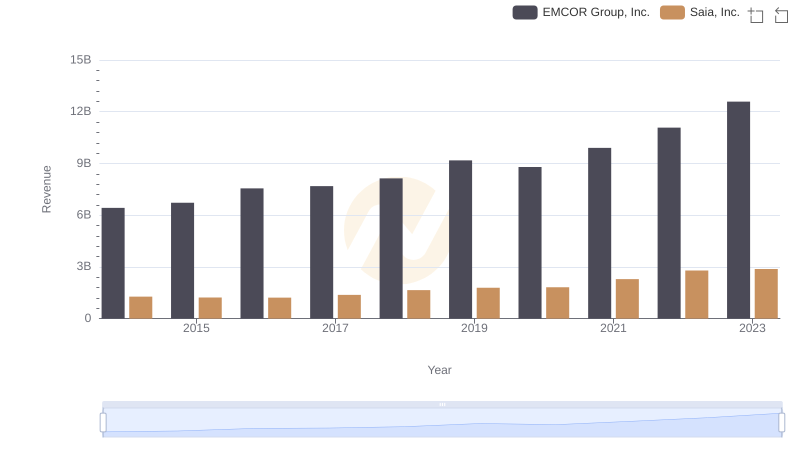
EMCOR Group, Inc. or Saia, Inc.: Who Leads in Yearly Revenue?
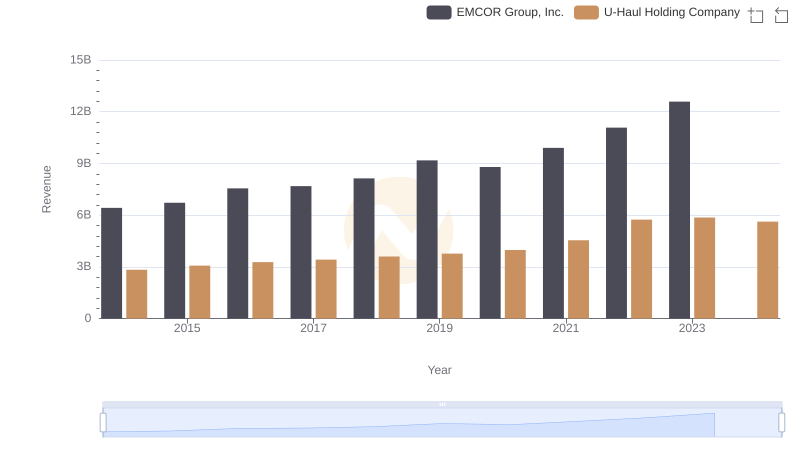
Comparing Revenue Performance: EMCOR Group, Inc. or U-Haul Holding Company?
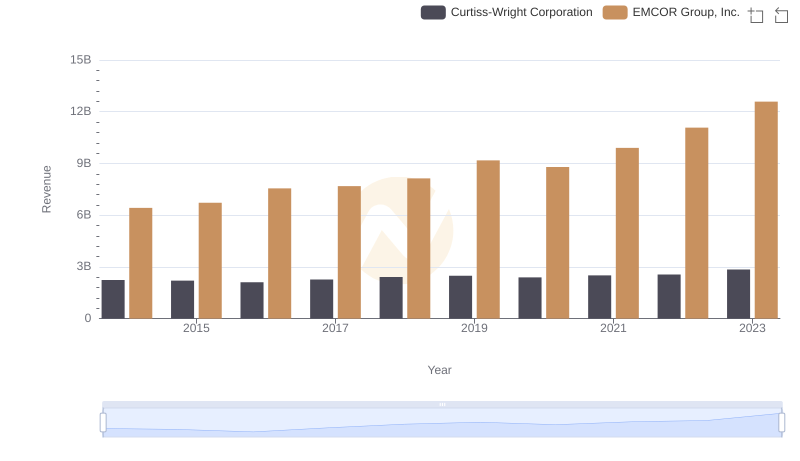
Comparing Revenue Performance: EMCOR Group, Inc. or Curtiss-Wright Corporation?
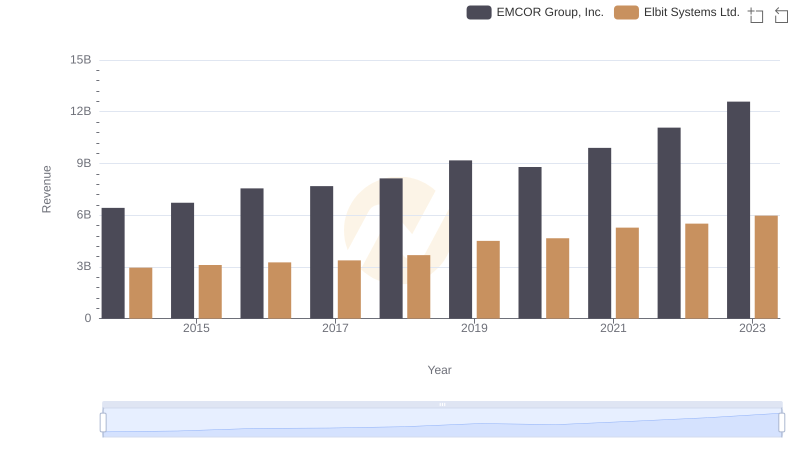
Comparing Revenue Performance: EMCOR Group, Inc. or Elbit Systems Ltd.?
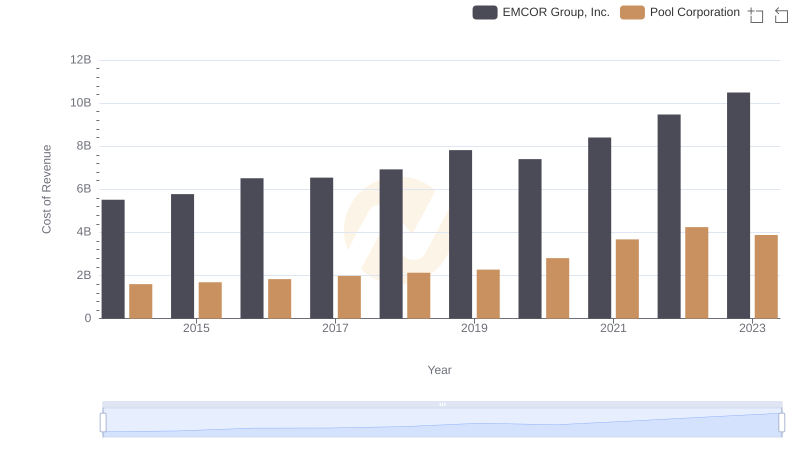
Cost of Revenue Comparison: EMCOR Group, Inc. vs Pool Corporation
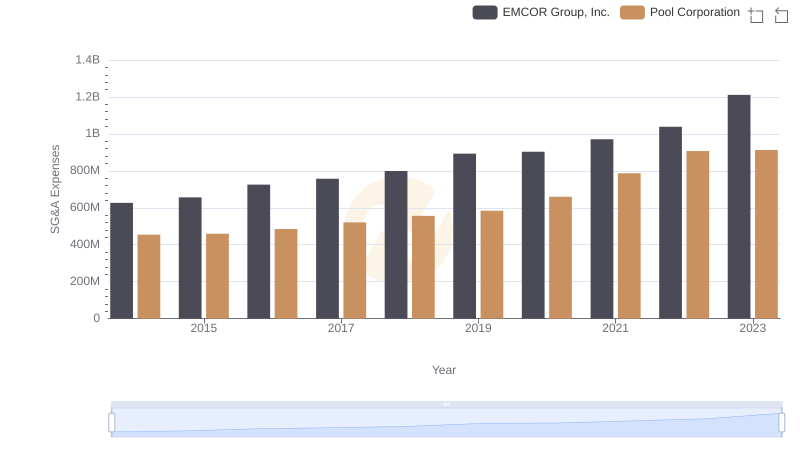
EMCOR Group, Inc. vs Pool Corporation: SG&A Expense Trends
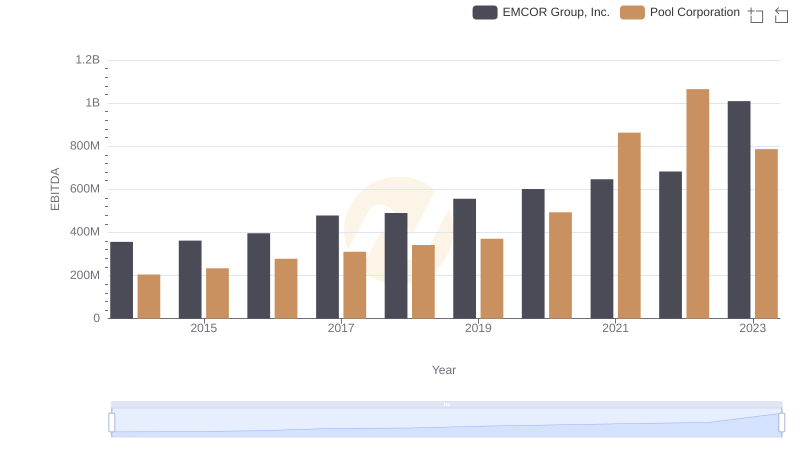
Professional EBITDA Benchmarking: EMCOR Group, Inc. vs Pool Corporation