| __timestamp | EMCOR Group, Inc. | Pool Corporation |
|---|---|---|
| Wednesday, January 1, 2014 | 626478000 | 454470000 |
| Thursday, January 1, 2015 | 656573000 | 459422000 |
| Friday, January 1, 2016 | 725538000 | 485228000 |
| Sunday, January 1, 2017 | 757062000 | 520918000 |
| Monday, January 1, 2018 | 799157000 | 556284000 |
| Tuesday, January 1, 2019 | 893453000 | 583679000 |
| Wednesday, January 1, 2020 | 903584000 | 659931000 |
| Friday, January 1, 2021 | 970937000 | 786808000 |
| Saturday, January 1, 2022 | 1038717000 | 907629000 |
| Sunday, January 1, 2023 | 1211233000 | 912927000 |
Data in motion
In the competitive landscape of the construction and pool supply industries, understanding financial trends is crucial. Over the past decade, EMCOR Group, Inc. and Pool Corporation have shown distinct trajectories in their Selling, General, and Administrative (SG&A) expenses. From 2014 to 2023, EMCOR's SG&A expenses surged by approximately 93%, reflecting its strategic expansion and operational scaling. In contrast, Pool Corporation's expenses increased by about 101%, indicating robust growth in the pool supply sector.
These trends underscore the dynamic nature of these industries and the strategic maneuvers of these companies to maintain their competitive edge.
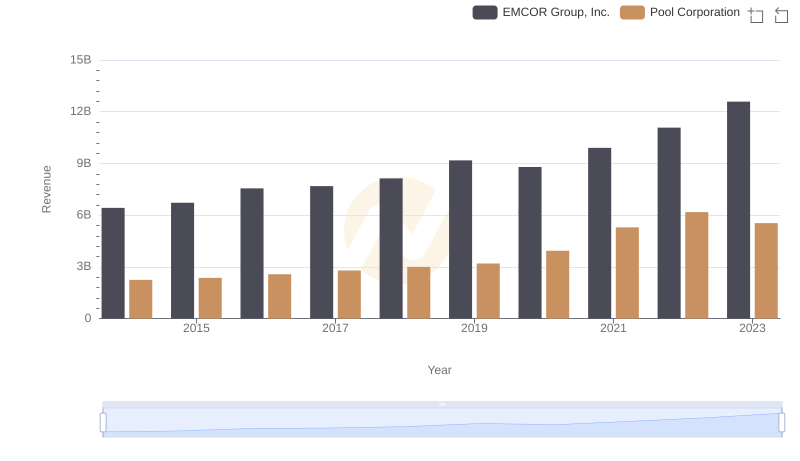
Annual Revenue Comparison: EMCOR Group, Inc. vs Pool Corporation
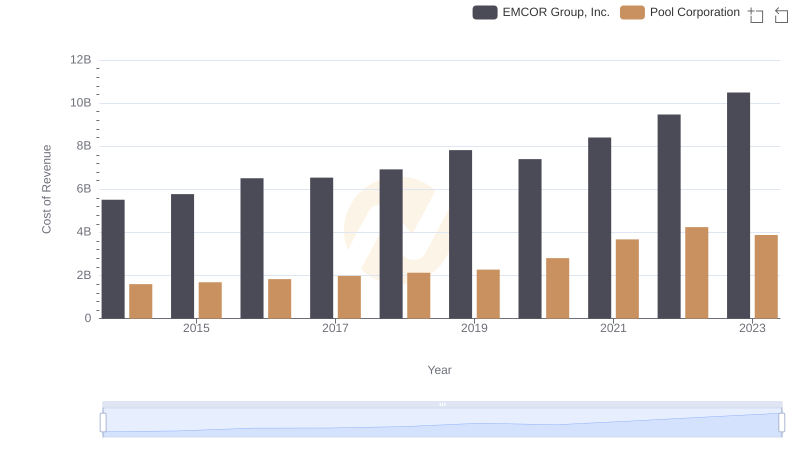
Cost of Revenue Comparison: EMCOR Group, Inc. vs Pool Corporation
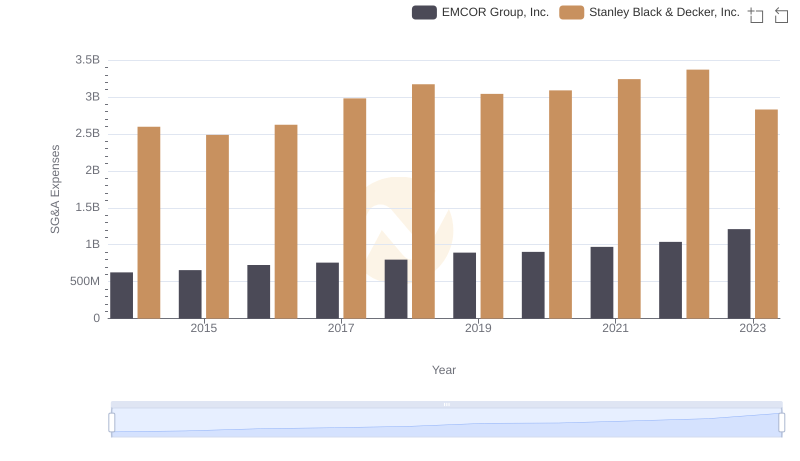
Selling, General, and Administrative Costs: EMCOR Group, Inc. vs Stanley Black & Decker, Inc.
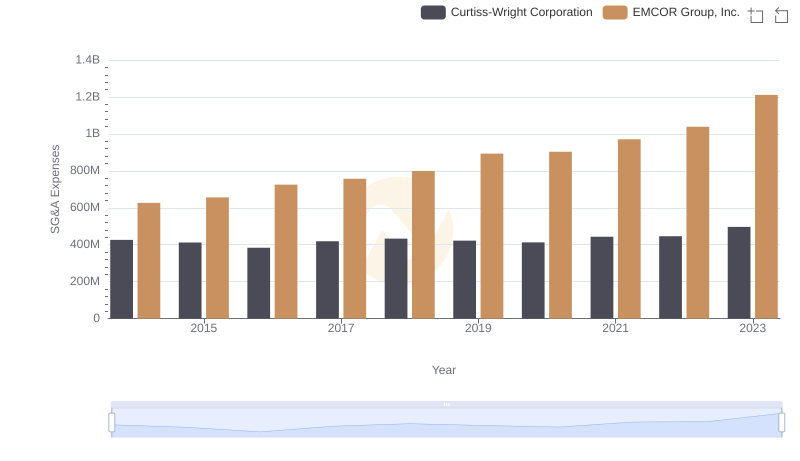
EMCOR Group, Inc. vs Curtiss-Wright Corporation: SG&A Expense Trends
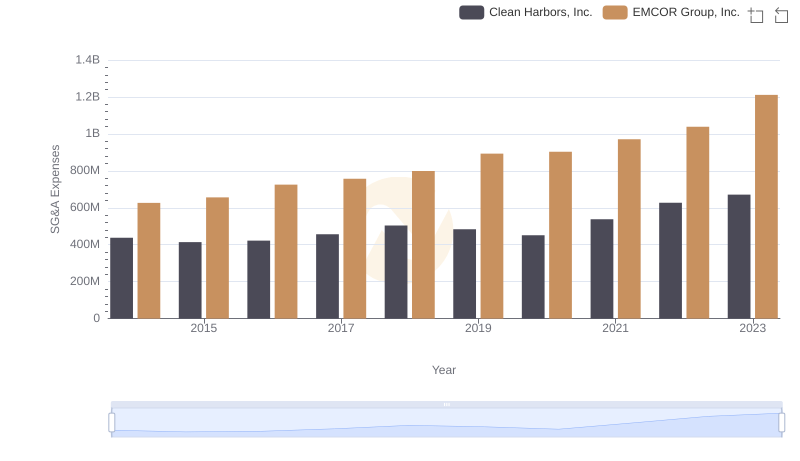
EMCOR Group, Inc. and Clean Harbors, Inc.: SG&A Spending Patterns Compared
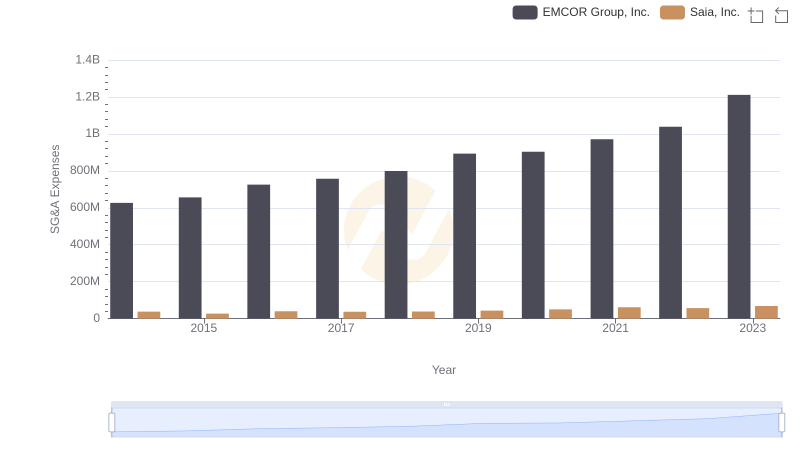
SG&A Efficiency Analysis: Comparing EMCOR Group, Inc. and Saia, Inc.
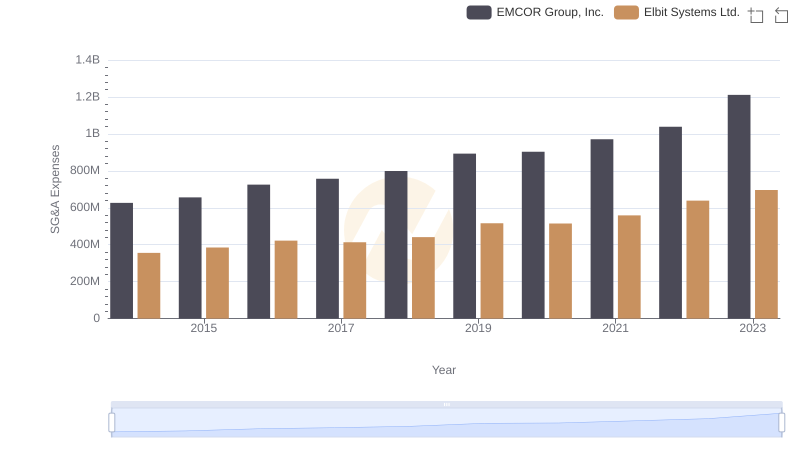
Breaking Down SG&A Expenses: EMCOR Group, Inc. vs Elbit Systems Ltd.
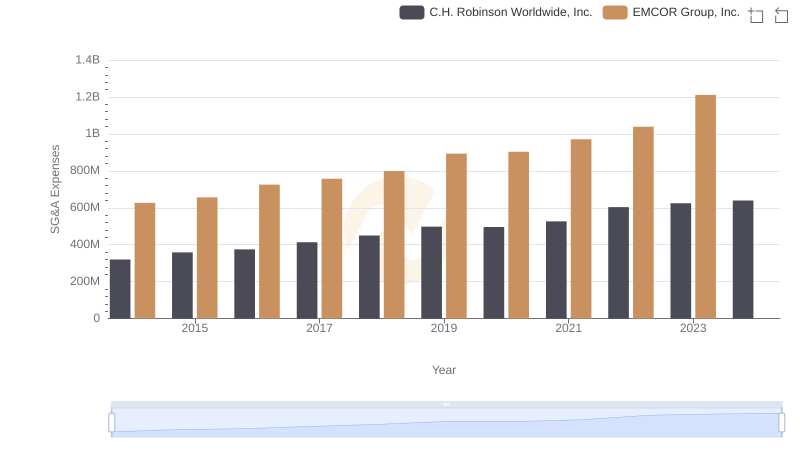
EMCOR Group, Inc. or C.H. Robinson Worldwide, Inc.: Who Manages SG&A Costs Better?
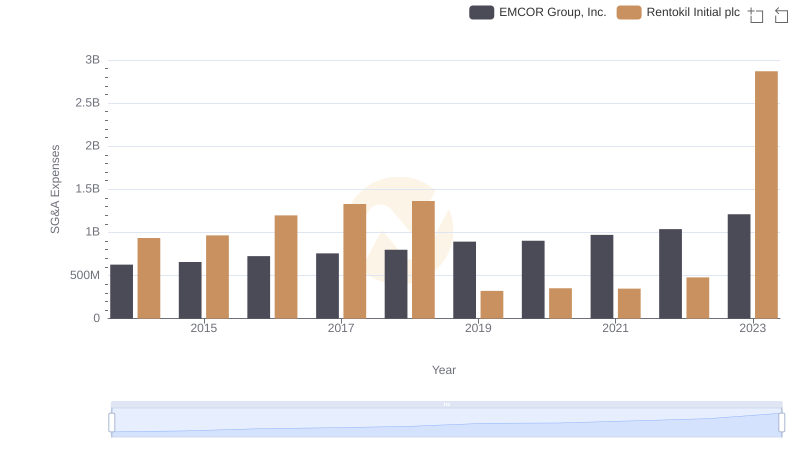
EMCOR Group, Inc. and Rentokil Initial plc: SG&A Spending Patterns Compared
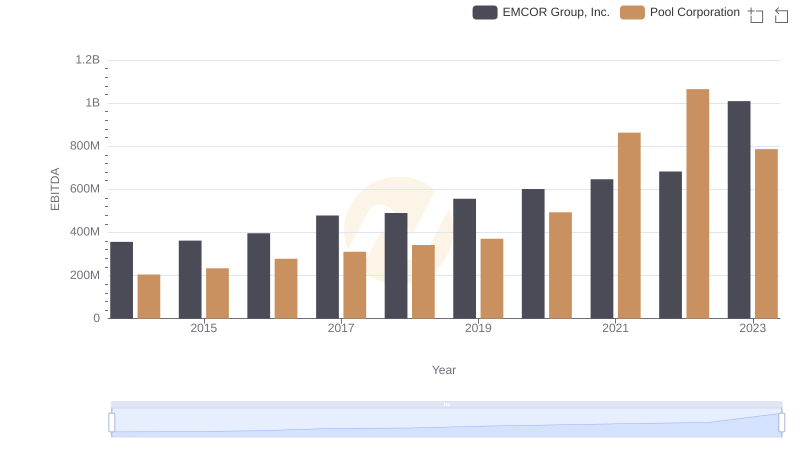
Professional EBITDA Benchmarking: EMCOR Group, Inc. vs Pool Corporation