| __timestamp | EMCOR Group, Inc. | Pool Corporation |
|---|---|---|
| Wednesday, January 1, 2014 | 5517719000 | 1603222000 |
| Thursday, January 1, 2015 | 5774247000 | 1687495000 |
| Friday, January 1, 2016 | 6513662000 | 1829716000 |
| Sunday, January 1, 2017 | 6539987000 | 1982899000 |
| Monday, January 1, 2018 | 6925178000 | 2127924000 |
| Tuesday, January 1, 2019 | 7818743000 | 2274592000 |
| Wednesday, January 1, 2020 | 7401679000 | 2805721000 |
| Friday, January 1, 2021 | 8401843000 | 3678492000 |
| Saturday, January 1, 2022 | 9472526000 | 4246315000 |
| Sunday, January 1, 2023 | 10493534000 | 3881551000 |
Cracking the code
In the ever-evolving landscape of the U.S. stock market, understanding the cost of revenue is crucial for investors and analysts alike. This metric, which represents the direct costs attributable to the production of goods sold by a company, offers insights into operational efficiency and profitability.
From 2014 to 2023, EMCOR Group, Inc. consistently outpaced Pool Corporation in terms of cost of revenue. EMCOR's cost of revenue grew by approximately 90%, peaking in 2023, while Pool Corporation saw a 142% increase, reaching its highest in 2022. Despite EMCOR's higher absolute figures, Pool's rapid growth highlights its expanding market presence.
This comparison underscores the diverse strategies and market dynamics shaping these industry leaders.
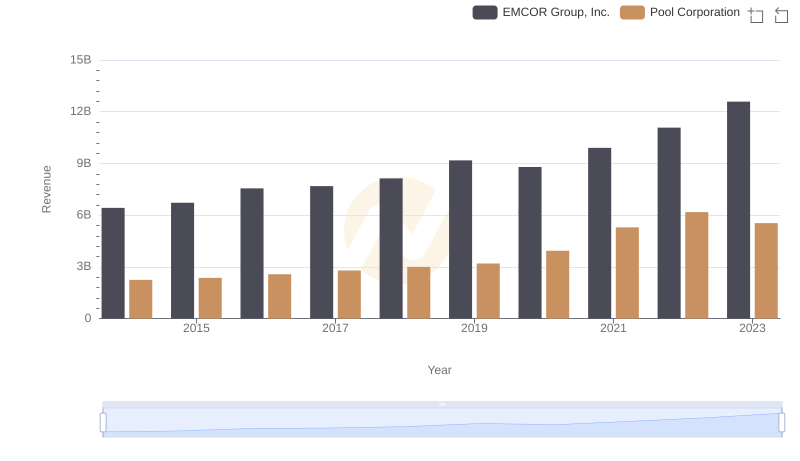
Annual Revenue Comparison: EMCOR Group, Inc. vs Pool Corporation
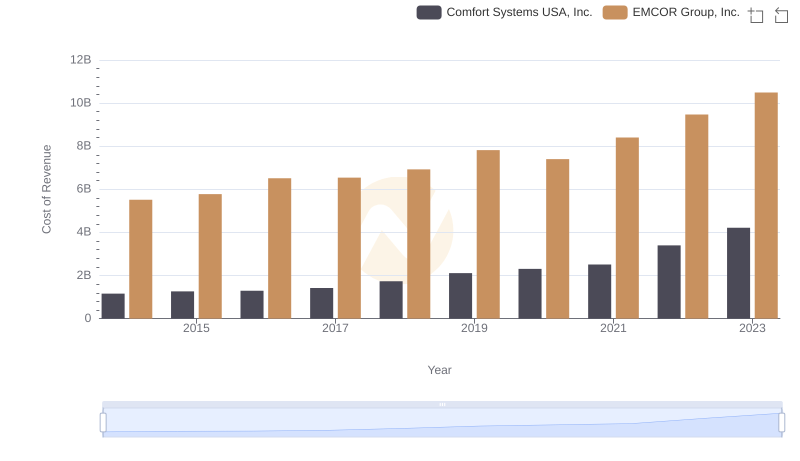
Cost of Revenue Trends: EMCOR Group, Inc. vs Comfort Systems USA, Inc.
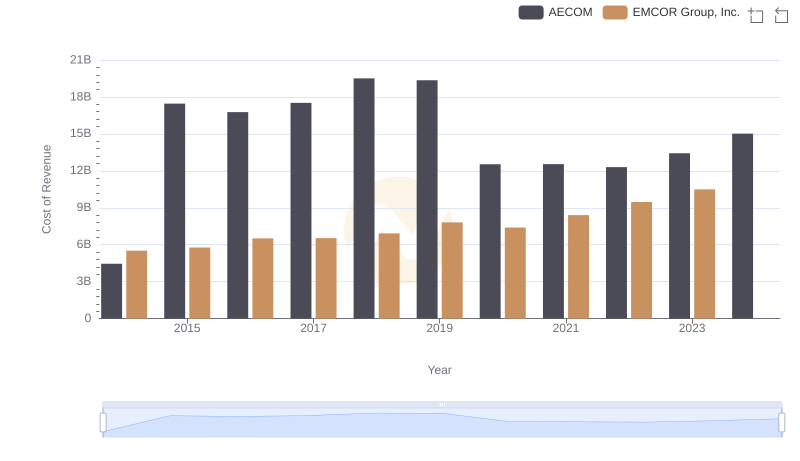
Cost of Revenue Trends: EMCOR Group, Inc. vs AECOM

Comparing Cost of Revenue Efficiency: EMCOR Group, Inc. vs Saia, Inc.
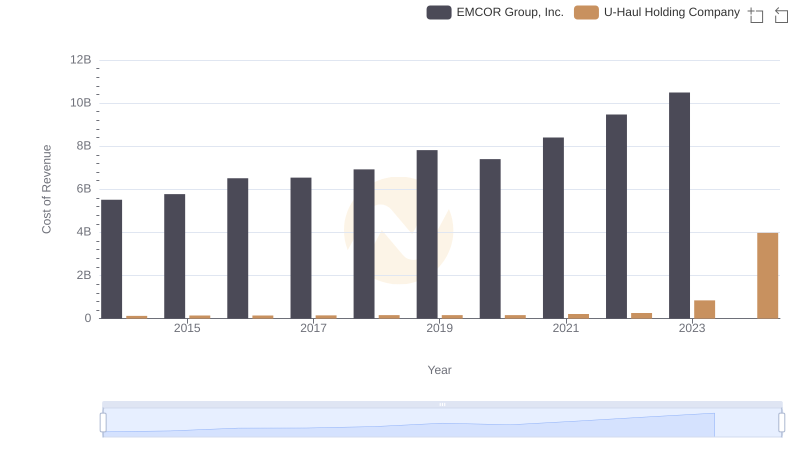
EMCOR Group, Inc. vs U-Haul Holding Company: Efficiency in Cost of Revenue Explored
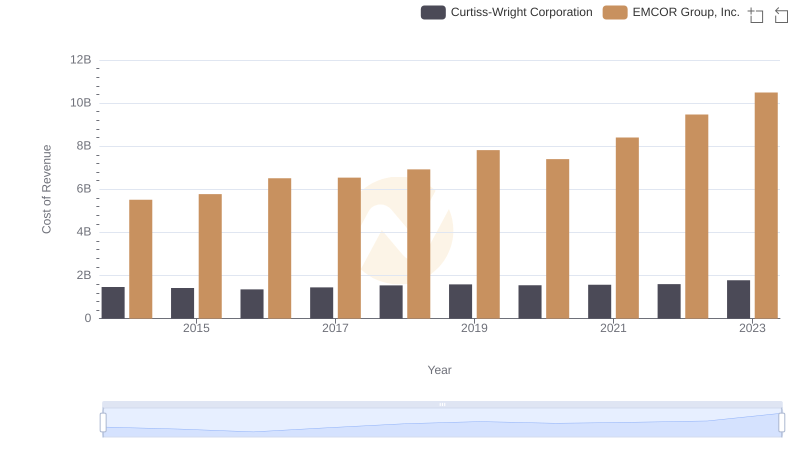
Comparing Cost of Revenue Efficiency: EMCOR Group, Inc. vs Curtiss-Wright Corporation
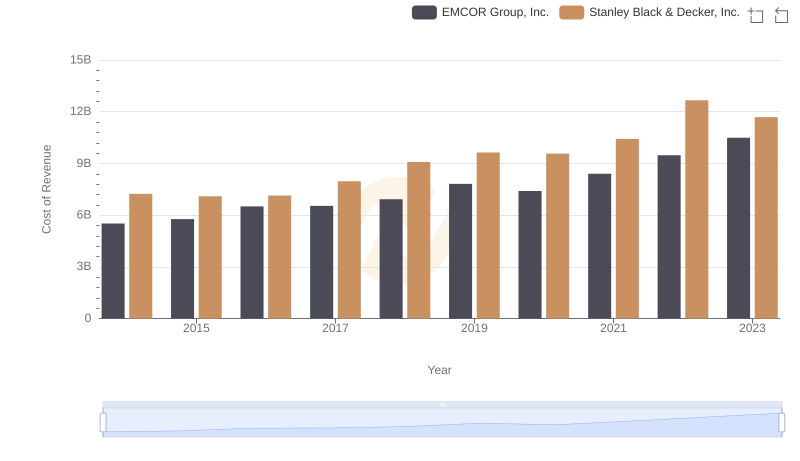
Cost of Revenue: Key Insights for EMCOR Group, Inc. and Stanley Black & Decker, Inc.
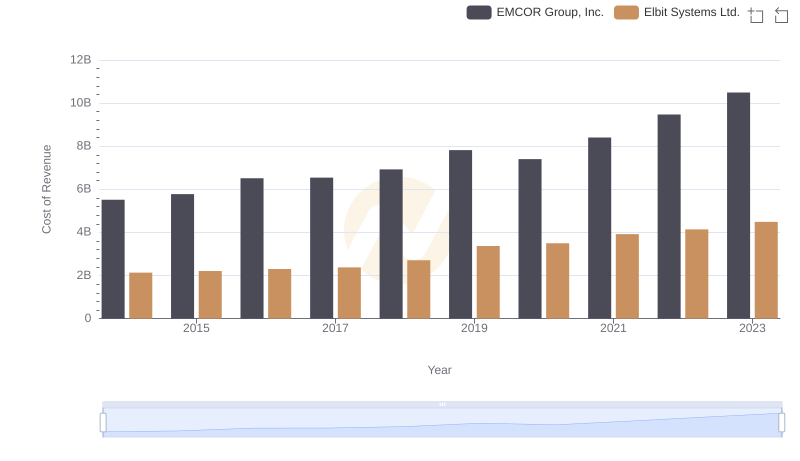
Cost of Revenue Trends: EMCOR Group, Inc. vs Elbit Systems Ltd.
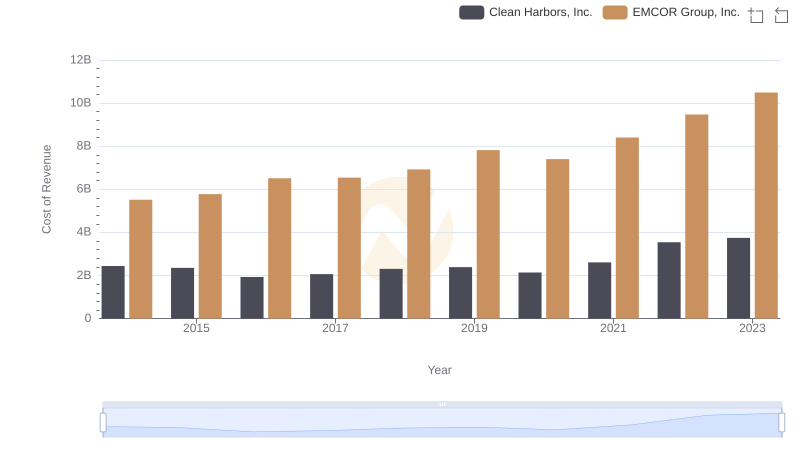
Cost of Revenue Trends: EMCOR Group, Inc. vs Clean Harbors, Inc.
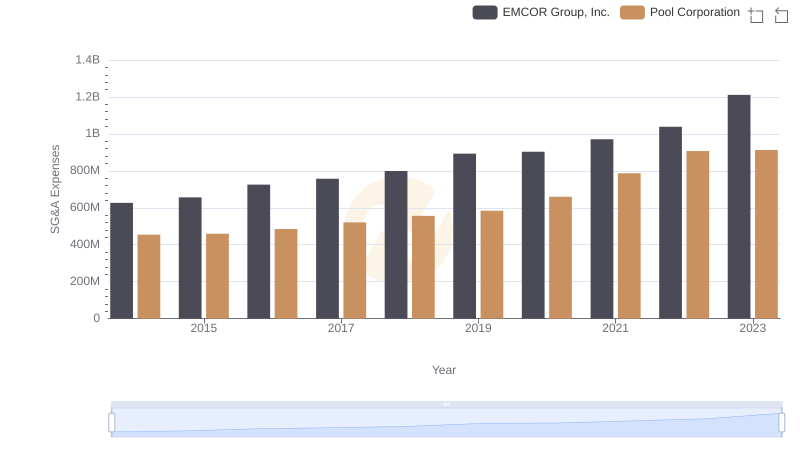
EMCOR Group, Inc. vs Pool Corporation: SG&A Expense Trends
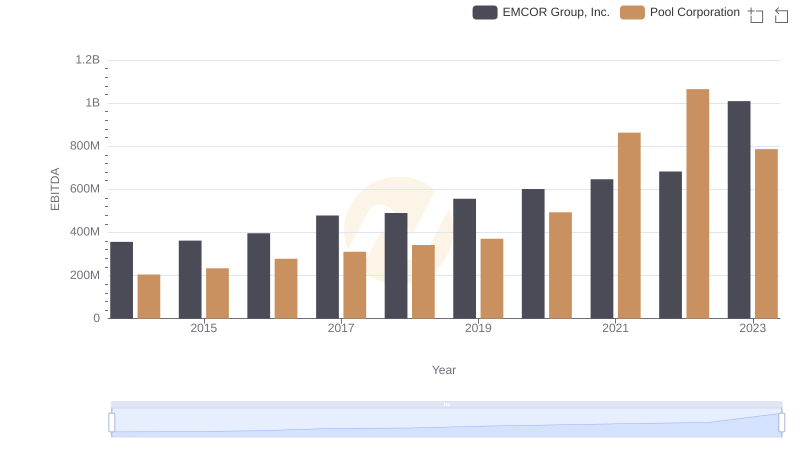
Professional EBITDA Benchmarking: EMCOR Group, Inc. vs Pool Corporation