| __timestamp | Comfort Systems USA, Inc. | Parker-Hannifin Corporation |
|---|---|---|
| Wednesday, January 1, 2014 | 249771000 | 3027744000 |
| Thursday, January 1, 2015 | 318129000 | 3056499000 |
| Friday, January 1, 2016 | 344009000 | 2537369000 |
| Sunday, January 1, 2017 | 366281000 | 2840350000 |
| Monday, January 1, 2018 | 446279000 | 3539551000 |
| Tuesday, January 1, 2019 | 501943000 | 3616840000 |
| Wednesday, January 1, 2020 | 546983000 | 3409002000 |
| Friday, January 1, 2021 | 563207000 | 3897960000 |
| Saturday, January 1, 2022 | 741608000 | 4474341000 |
| Sunday, January 1, 2023 | 990509000 | 6429302000 |
| Monday, January 1, 2024 | 7127790000 |
Data in motion
In the competitive landscape of industrial and comfort systems, Parker-Hannifin Corporation and Comfort Systems USA, Inc. have showcased distinct trajectories in gross profit over the past decade. From 2014 to 2023, Parker-Hannifin consistently outperformed, with a peak gross profit in 2023 that was over 150% higher than its 2014 figures. Comfort Systems USA, Inc., while starting at a lower base, demonstrated impressive growth, nearly quadrupling its gross profit by 2023. This period highlights Parker-Hannifin's robust market position and Comfort Systems' dynamic growth strategy. Notably, the data for 2024 is incomplete, leaving room for speculation on future trends. As these companies continue to evolve, their financial performances offer valuable insights into the broader industrial and comfort systems sectors.
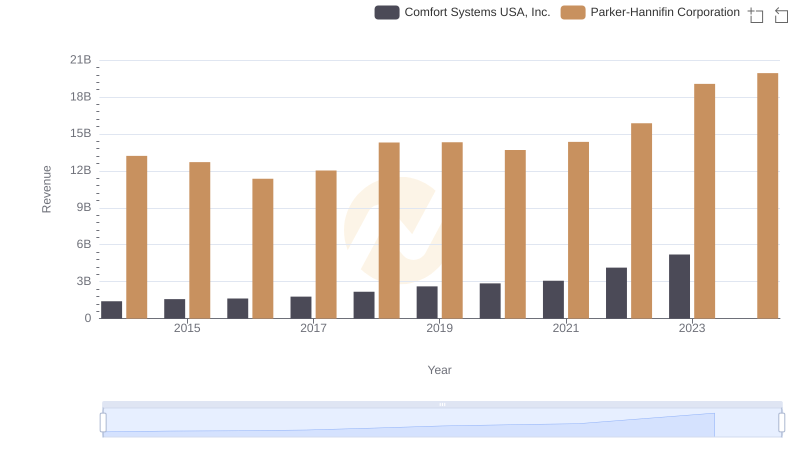
Revenue Insights: Parker-Hannifin Corporation and Comfort Systems USA, Inc. Performance Compared
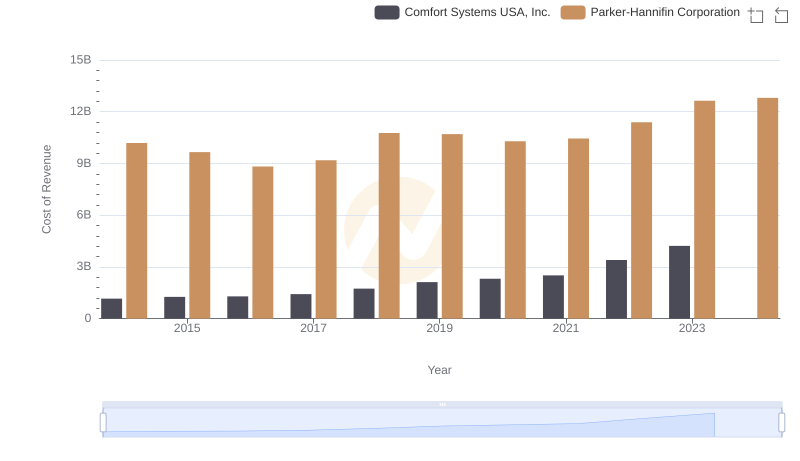
Cost of Revenue Comparison: Parker-Hannifin Corporation vs Comfort Systems USA, Inc.
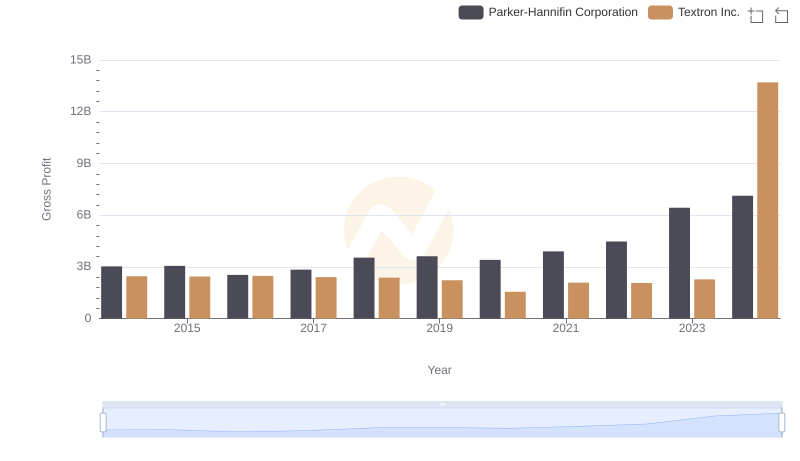
Who Generates Higher Gross Profit? Parker-Hannifin Corporation or Textron Inc.
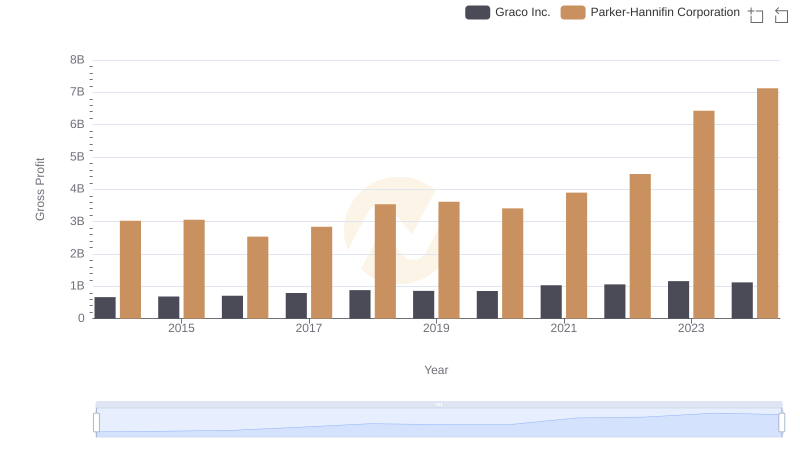
Gross Profit Analysis: Comparing Parker-Hannifin Corporation and Graco Inc.
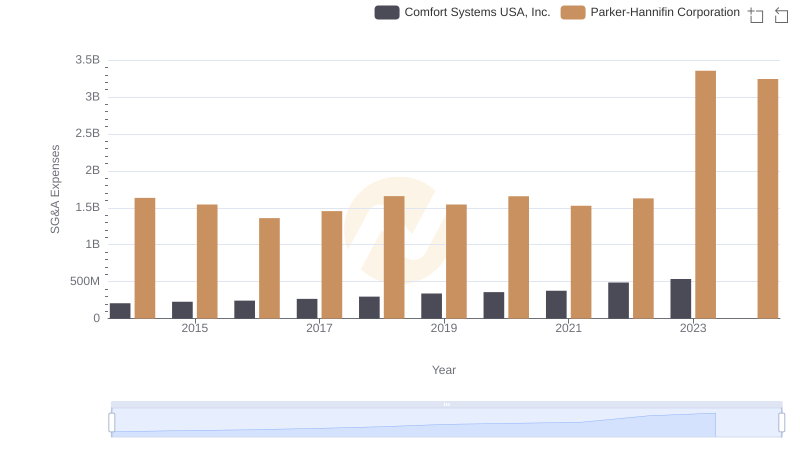
Operational Costs Compared: SG&A Analysis of Parker-Hannifin Corporation and Comfort Systems USA, Inc.
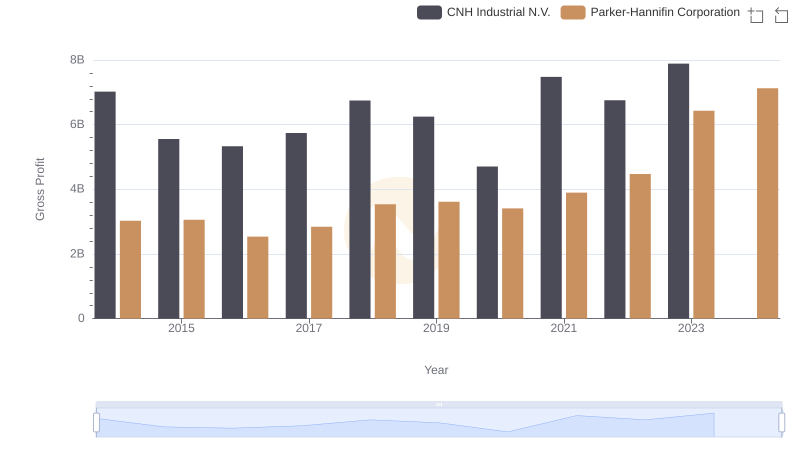
Parker-Hannifin Corporation and CNH Industrial N.V.: A Detailed Gross Profit Analysis
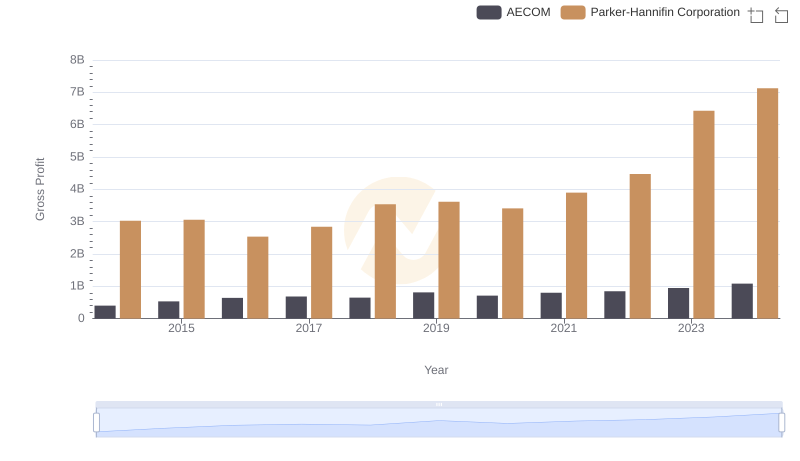
Gross Profit Comparison: Parker-Hannifin Corporation and AECOM Trends
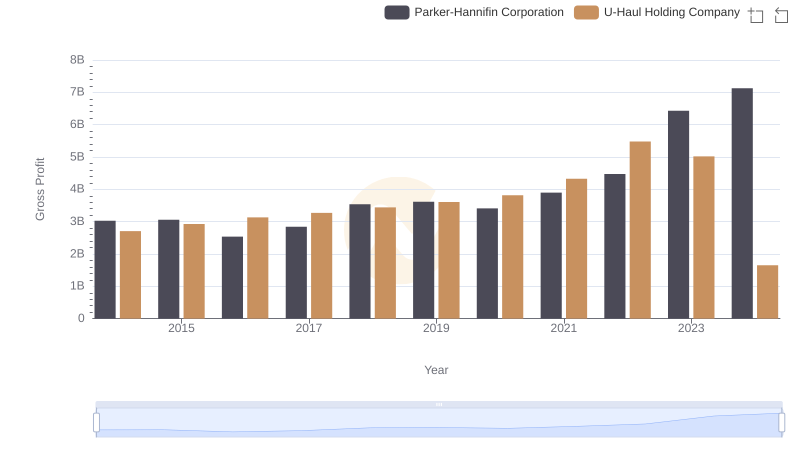
Gross Profit Trends Compared: Parker-Hannifin Corporation vs U-Haul Holding Company
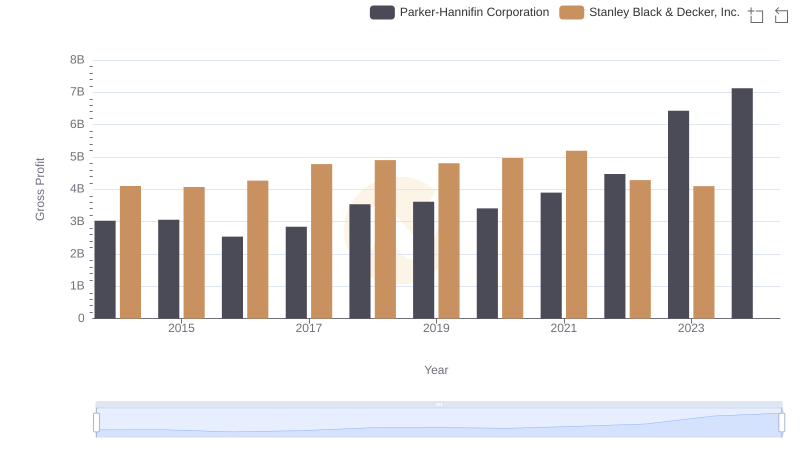
Gross Profit Comparison: Parker-Hannifin Corporation and Stanley Black & Decker, Inc. Trends
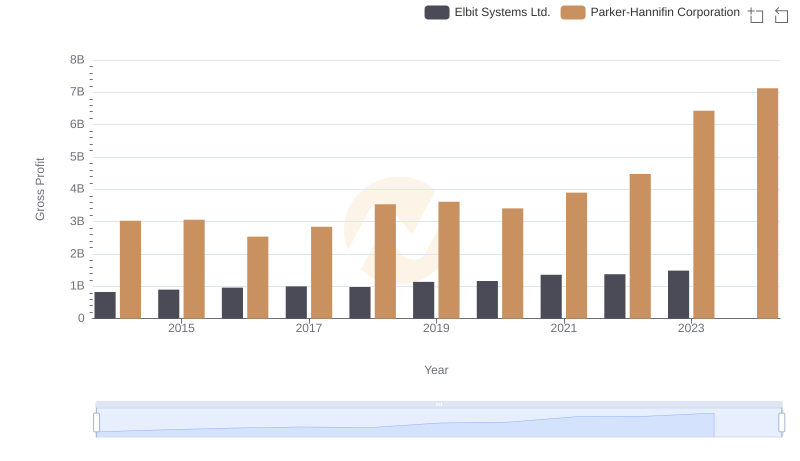
Gross Profit Trends Compared: Parker-Hannifin Corporation vs Elbit Systems Ltd.
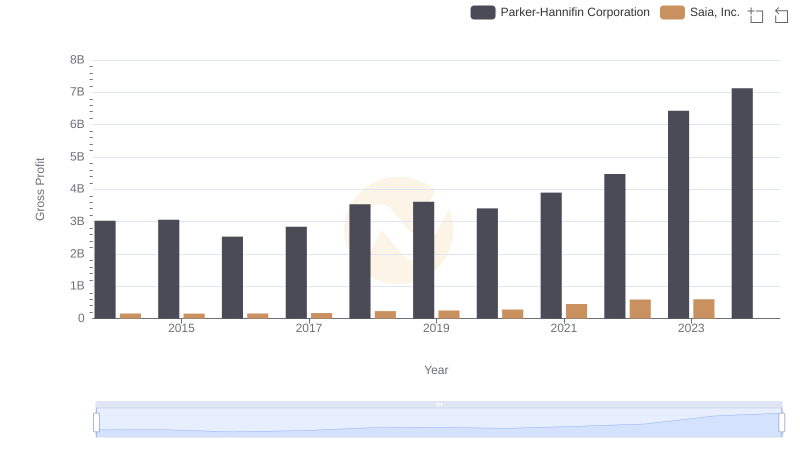
Gross Profit Trends Compared: Parker-Hannifin Corporation vs Saia, Inc.
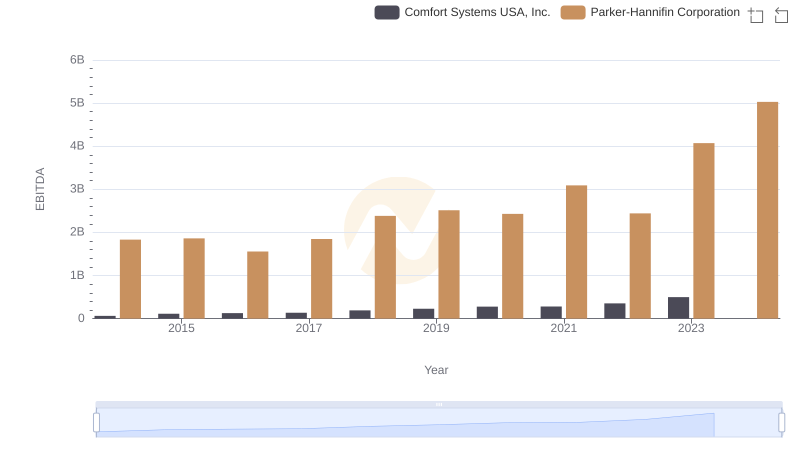
Parker-Hannifin Corporation and Comfort Systems USA, Inc.: A Detailed Examination of EBITDA Performance