| __timestamp | Comfort Systems USA, Inc. | Parker-Hannifin Corporation |
|---|---|---|
| Wednesday, January 1, 2014 | 207652000 | 1633992000 |
| Thursday, January 1, 2015 | 228965000 | 1544746000 |
| Friday, January 1, 2016 | 243201000 | 1359360000 |
| Sunday, January 1, 2017 | 266586000 | 1453935000 |
| Monday, January 1, 2018 | 296986000 | 1657152000 |
| Tuesday, January 1, 2019 | 340005000 | 1543939000 |
| Wednesday, January 1, 2020 | 357777000 | 1656553000 |
| Friday, January 1, 2021 | 376309000 | 1527302000 |
| Saturday, January 1, 2022 | 489344000 | 1627116000 |
| Sunday, January 1, 2023 | 536188999 | 3354103000 |
| Monday, January 1, 2024 | 3315177000 |
Unlocking the unknown
In the ever-evolving landscape of industrial and building systems, understanding operational costs is crucial. This analysis delves into the Selling, General, and Administrative (SG&A) expenses of Parker-Hannifin Corporation and Comfort Systems USA, Inc. over the past decade. From 2014 to 2023, Parker-Hannifin's SG&A expenses have shown a steady increase, peaking in 2023 with a staggering 105% rise compared to 2014. Comfort Systems USA, Inc. also experienced a significant upward trend, with a 158% increase in the same period. Notably, 2023 marked a dramatic surge for Parker-Hannifin, with expenses reaching over double the previous year's figures. This data highlights the dynamic nature of operational costs in these industries, emphasizing the importance of strategic financial management. Missing data for 2024 suggests a need for cautious interpretation of future trends.
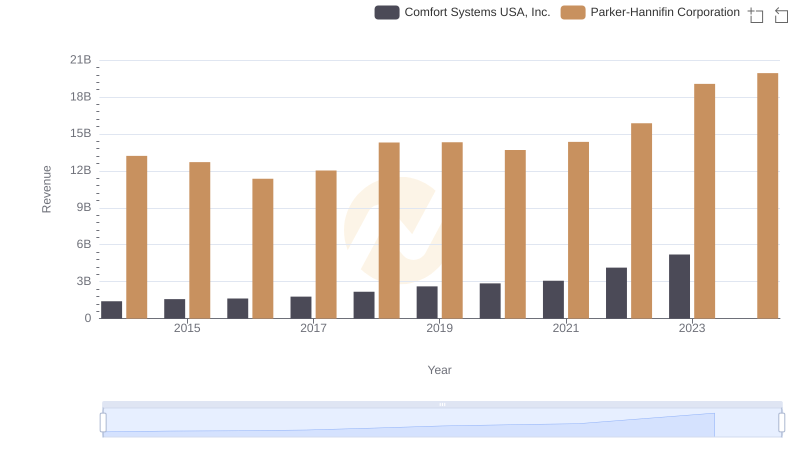
Revenue Insights: Parker-Hannifin Corporation and Comfort Systems USA, Inc. Performance Compared
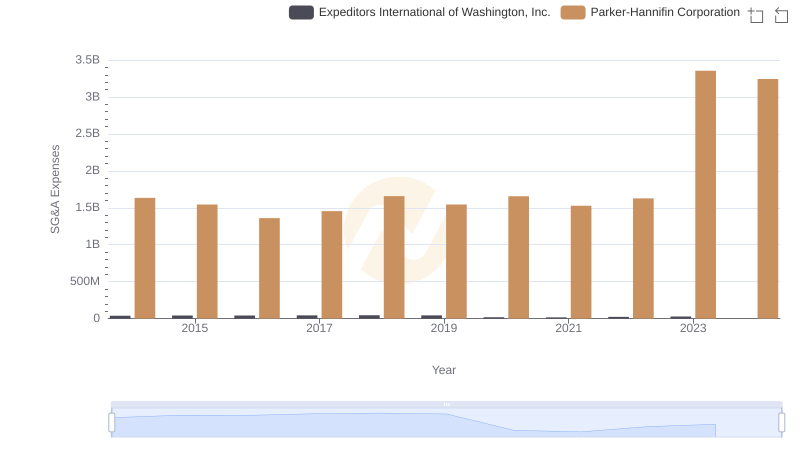
Who Optimizes SG&A Costs Better? Parker-Hannifin Corporation or Expeditors International of Washington, Inc.
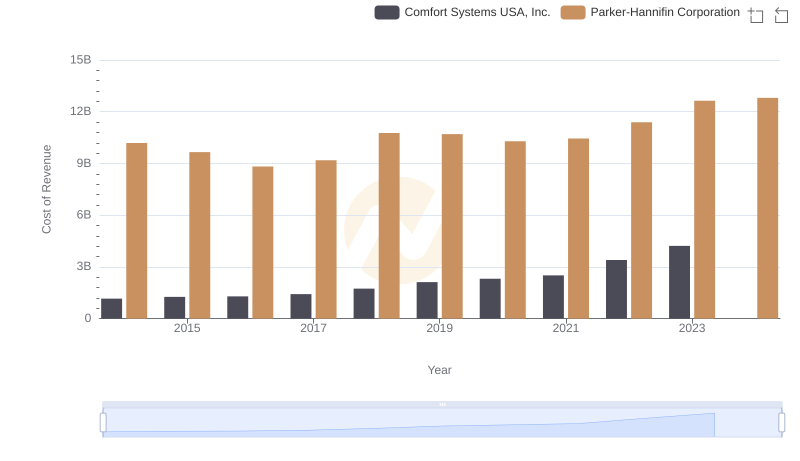
Cost of Revenue Comparison: Parker-Hannifin Corporation vs Comfort Systems USA, Inc.
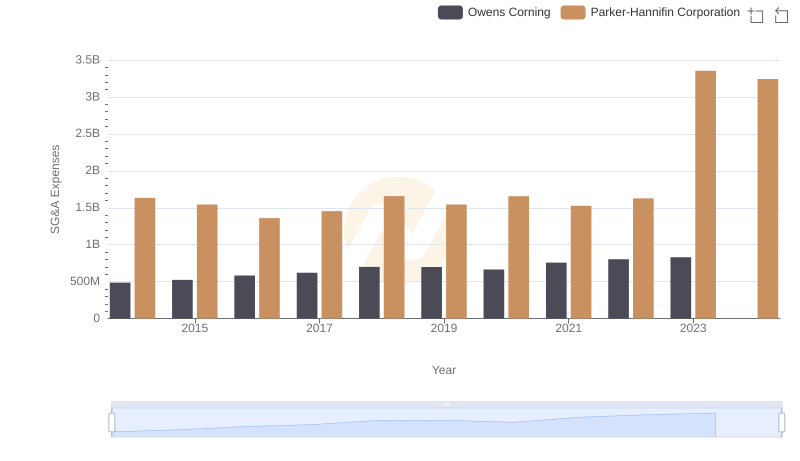
Operational Costs Compared: SG&A Analysis of Parker-Hannifin Corporation and Owens Corning
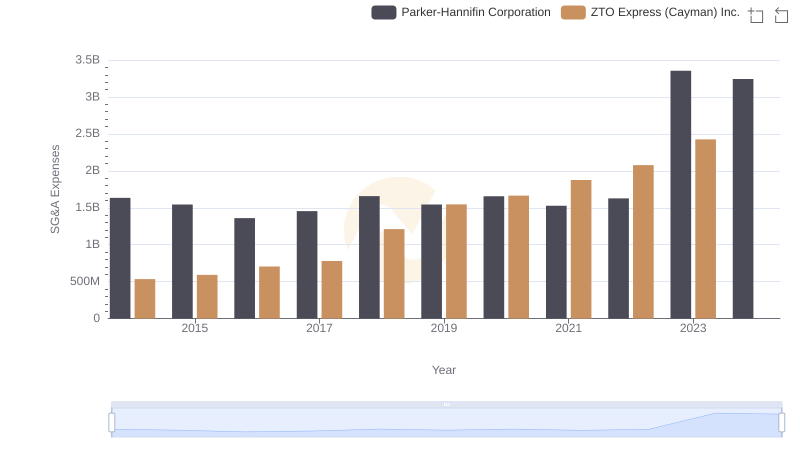
SG&A Efficiency Analysis: Comparing Parker-Hannifin Corporation and ZTO Express (Cayman) Inc.
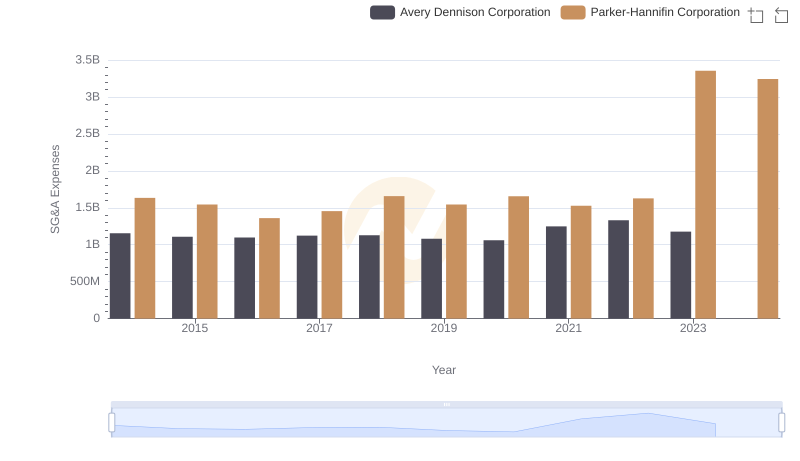
Parker-Hannifin Corporation and Avery Dennison Corporation: SG&A Spending Patterns Compared

Parker-Hannifin Corporation vs Comfort Systems USA, Inc.: A Gross Profit Performance Breakdown
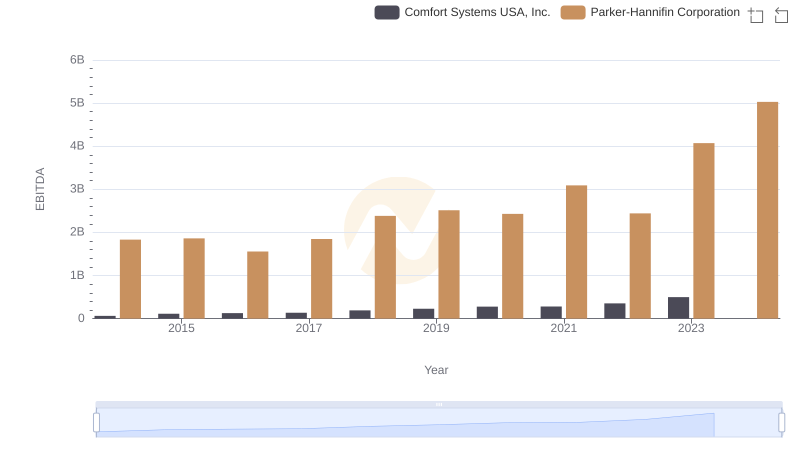
Parker-Hannifin Corporation and Comfort Systems USA, Inc.: A Detailed Examination of EBITDA Performance
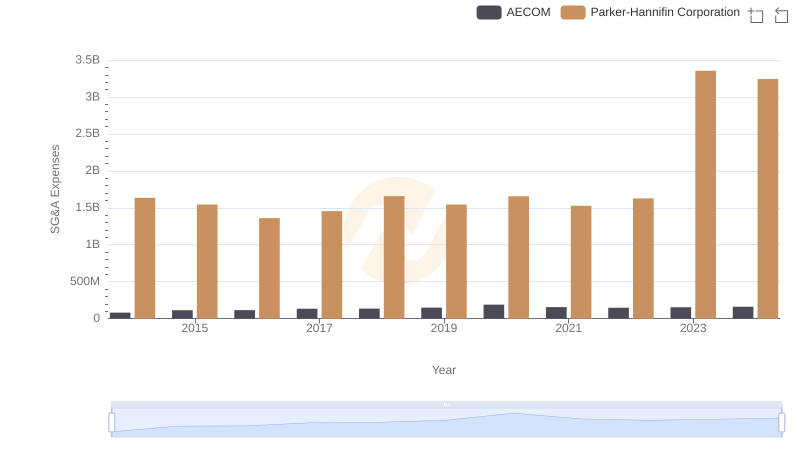
SG&A Efficiency Analysis: Comparing Parker-Hannifin Corporation and AECOM
Operational Costs Compared: SG&A Analysis of Parker-Hannifin Corporation and U-Haul Holding Company