| __timestamp | CNH Industrial N.V. | Parker-Hannifin Corporation |
|---|---|---|
| Wednesday, January 1, 2014 | 7021000000 | 3027744000 |
| Thursday, January 1, 2015 | 5555000000 | 3056499000 |
| Friday, January 1, 2016 | 5333000000 | 2537369000 |
| Sunday, January 1, 2017 | 5740000000 | 2840350000 |
| Monday, January 1, 2018 | 6748000000 | 3539551000 |
| Tuesday, January 1, 2019 | 6247000000 | 3616840000 |
| Wednesday, January 1, 2020 | 4705000000 | 3409002000 |
| Friday, January 1, 2021 | 7477000000 | 3897960000 |
| Saturday, January 1, 2022 | 6754000000 | 4474341000 |
| Sunday, January 1, 2023 | 7889000000 | 6429302000 |
| Monday, January 1, 2024 | 7127790000 |
Unleashing the power of data
In the ever-evolving landscape of industrial manufacturing, Parker-Hannifin Corporation and CNH Industrial N.V. have emerged as key players. Over the past decade, these giants have showcased intriguing trends in their gross profit margins. From 2014 to 2023, CNH Industrial's gross profit fluctuated, peaking in 2023 with a 12% increase from 2022, while Parker-Hannifin demonstrated a consistent upward trajectory, culminating in a remarkable 43% rise in 2023 compared to the previous year.
These trends highlight the dynamic nature of the industrial sector, with each company navigating its unique challenges and opportunities.
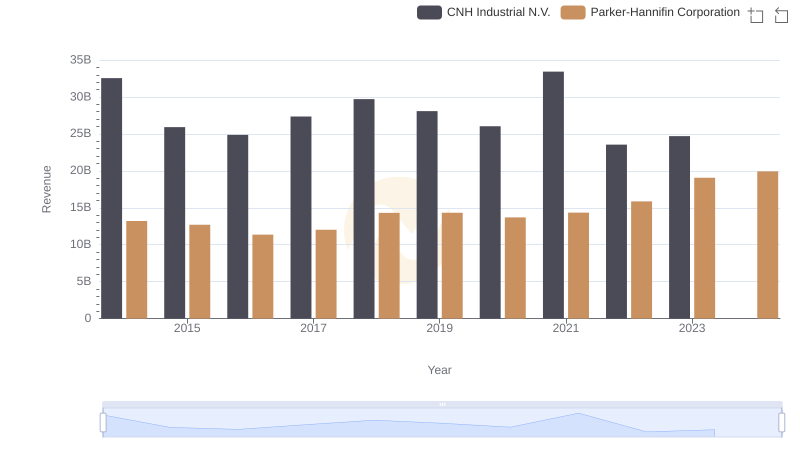
Breaking Down Revenue Trends: Parker-Hannifin Corporation vs CNH Industrial N.V.
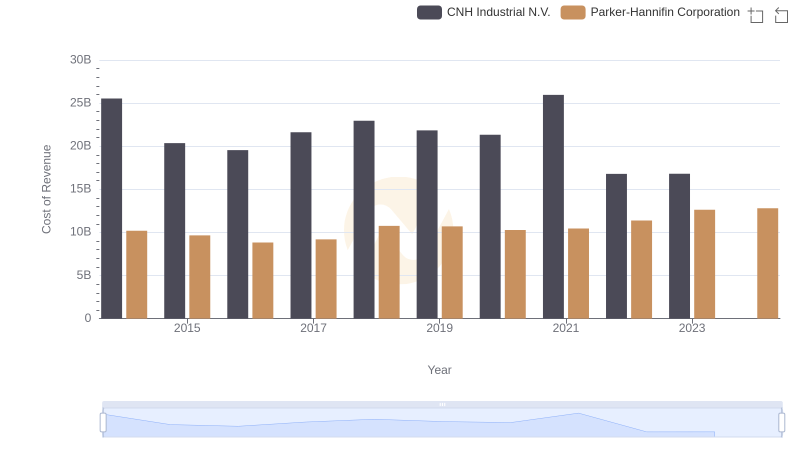
Analyzing Cost of Revenue: Parker-Hannifin Corporation and CNH Industrial N.V.

Parker-Hannifin Corporation vs Comfort Systems USA, Inc.: A Gross Profit Performance Breakdown
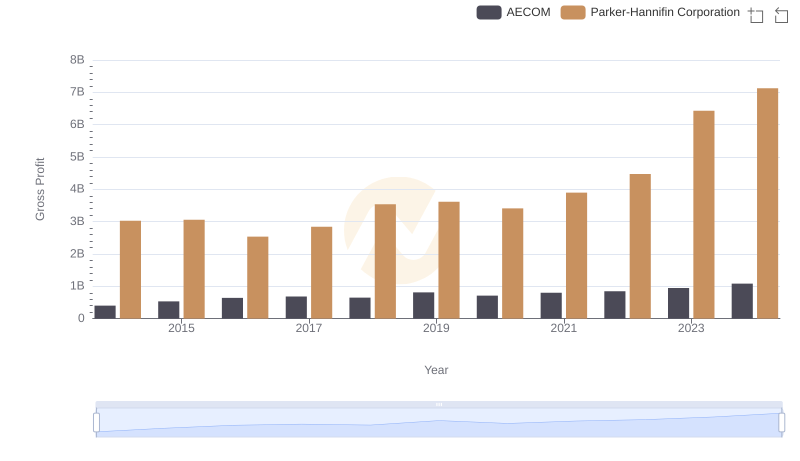
Gross Profit Comparison: Parker-Hannifin Corporation and AECOM Trends
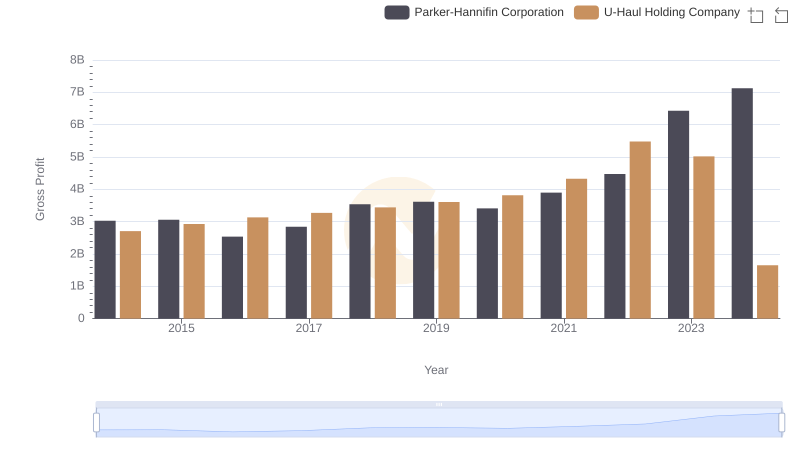
Gross Profit Trends Compared: Parker-Hannifin Corporation vs U-Haul Holding Company
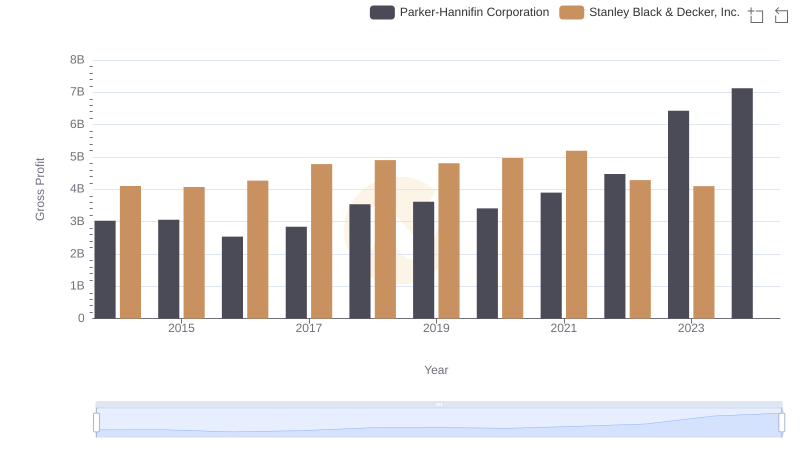
Gross Profit Comparison: Parker-Hannifin Corporation and Stanley Black & Decker, Inc. Trends
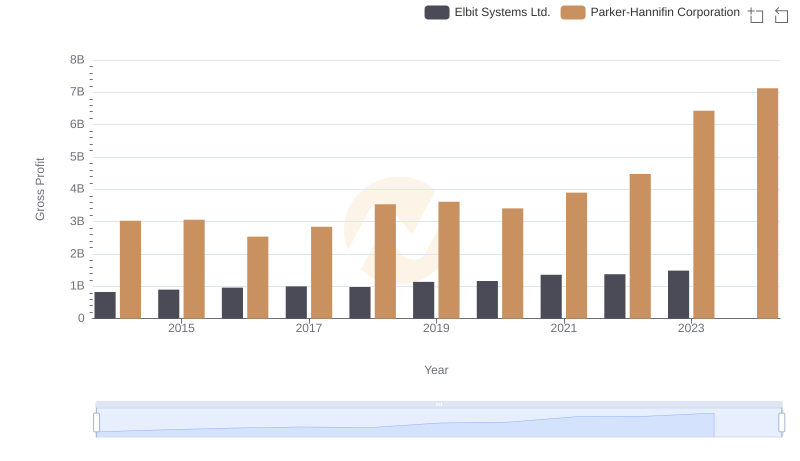
Gross Profit Trends Compared: Parker-Hannifin Corporation vs Elbit Systems Ltd.
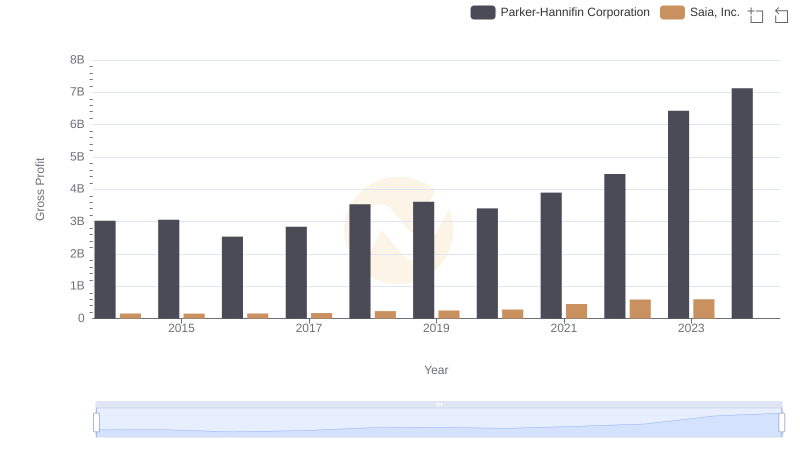
Gross Profit Trends Compared: Parker-Hannifin Corporation vs Saia, Inc.
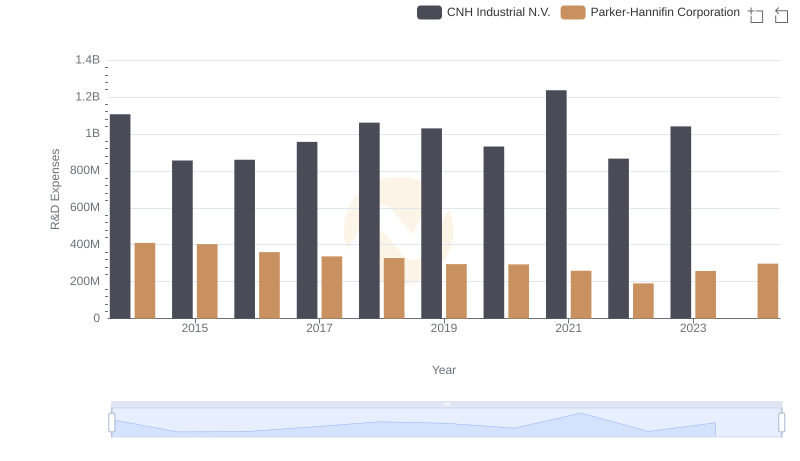
Parker-Hannifin Corporation vs CNH Industrial N.V.: Strategic Focus on R&D Spending
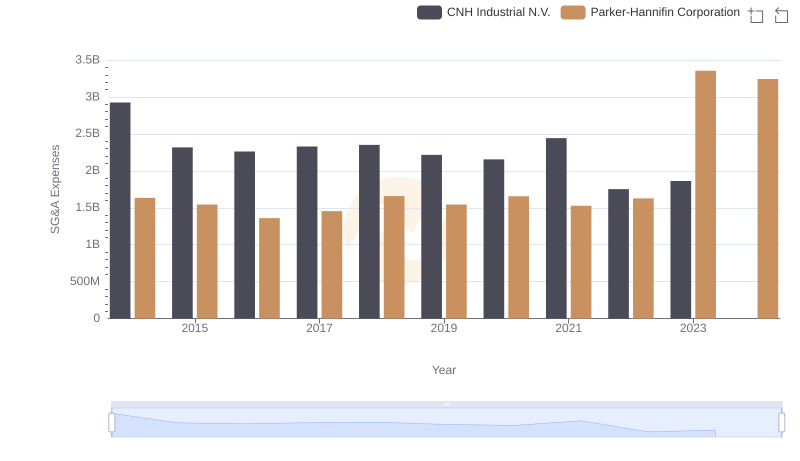
Who Optimizes SG&A Costs Better? Parker-Hannifin Corporation or CNH Industrial N.V.
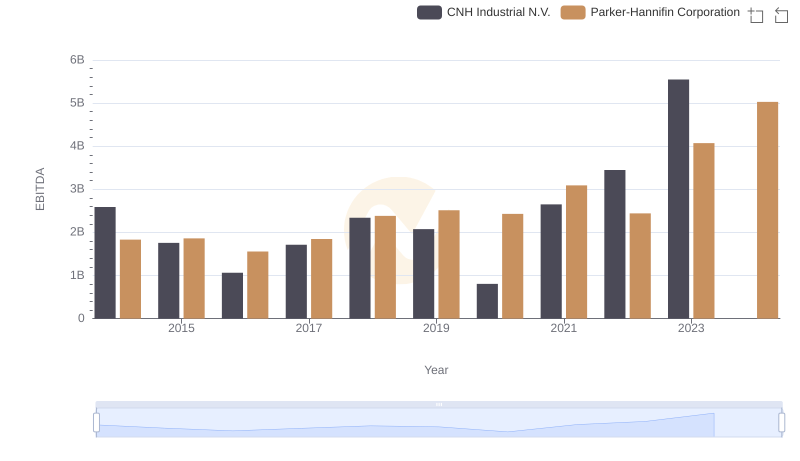
Comprehensive EBITDA Comparison: Parker-Hannifin Corporation vs CNH Industrial N.V.