| __timestamp | Parker-Hannifin Corporation | Stanley Black & Decker, Inc. |
|---|---|---|
| Wednesday, January 1, 2014 | 3027744000 | 4102700000 |
| Thursday, January 1, 2015 | 3056499000 | 4072000000 |
| Friday, January 1, 2016 | 2537369000 | 4267200000 |
| Sunday, January 1, 2017 | 2840350000 | 4778000000 |
| Monday, January 1, 2018 | 3539551000 | 4901900000 |
| Tuesday, January 1, 2019 | 3616840000 | 4805500000 |
| Wednesday, January 1, 2020 | 3409002000 | 4967900000 |
| Friday, January 1, 2021 | 3897960000 | 5194200000 |
| Saturday, January 1, 2022 | 4474341000 | 4284100000 |
| Sunday, January 1, 2023 | 6429302000 | 4098000000 |
| Monday, January 1, 2024 | 7127790000 | 4514400000 |
Igniting the spark of knowledge
In the ever-evolving landscape of industrial manufacturing, Parker-Hannifin Corporation and Stanley Black & Decker, Inc. have long been titans. Over the past decade, these companies have showcased intriguing trends in their gross profit margins. From 2014 to 2023, Parker-Hannifin's gross profit surged by over 135%, peaking in 2023, while Stanley Black & Decker experienced a more modest 0.2% increase, with fluctuations along the way.
These trends highlight the dynamic nature of the industrial sector, where strategic decisions and market conditions can lead to significant financial shifts.
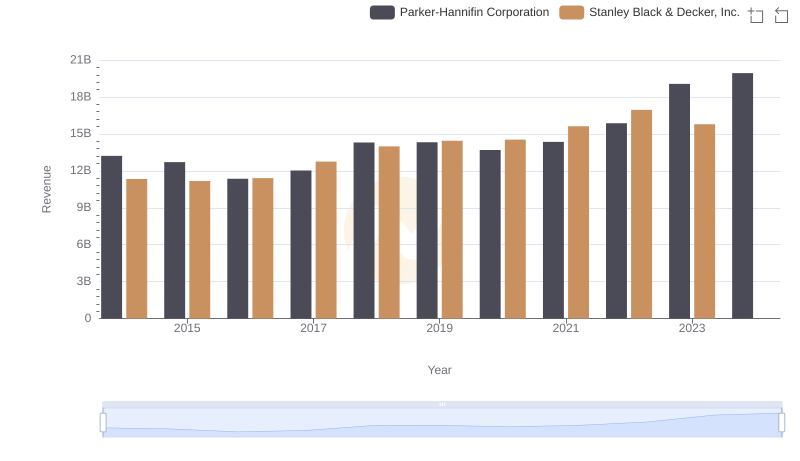
Parker-Hannifin Corporation and Stanley Black & Decker, Inc.: A Comprehensive Revenue Analysis

Cost of Revenue Trends: Parker-Hannifin Corporation vs Stanley Black & Decker, Inc.
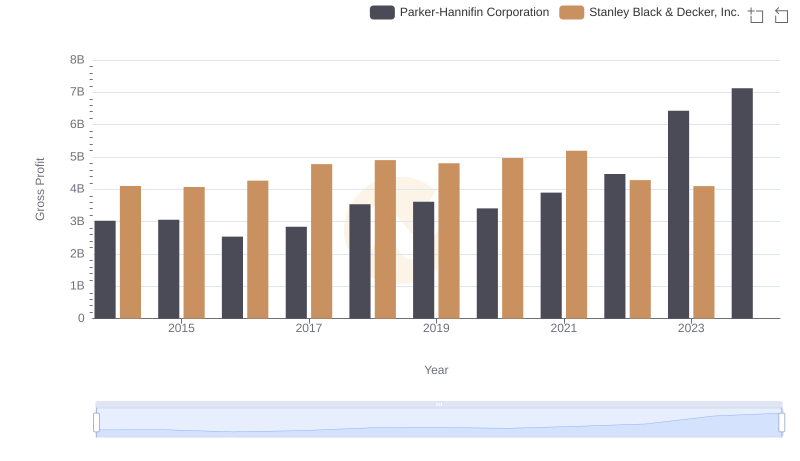
Parker-Hannifin Corporation and Stanley Black & Decker, Inc.: A Detailed Gross Profit Analysis

Research and Development Expenses Breakdown: Parker-Hannifin Corporation vs Stanley Black & Decker, Inc.
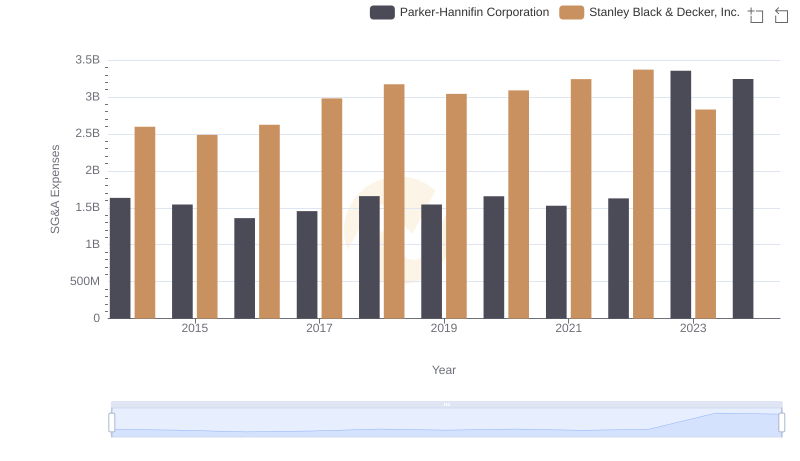
Operational Costs Compared: SG&A Analysis of Parker-Hannifin Corporation and Stanley Black & Decker, Inc.
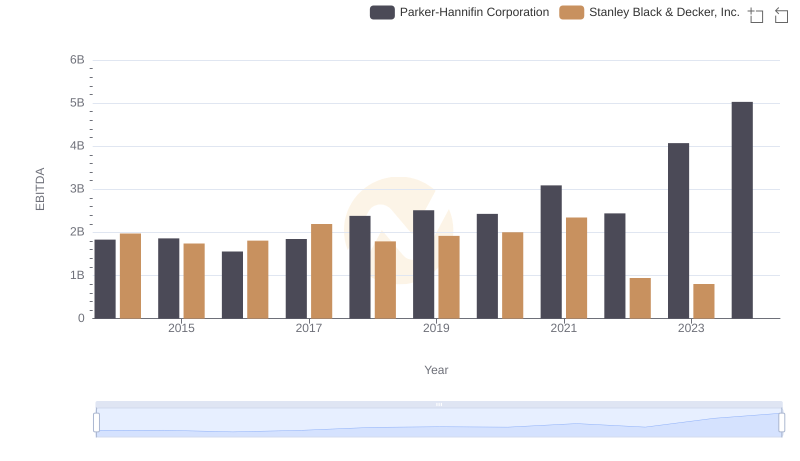
Comparative EBITDA Analysis: Parker-Hannifin Corporation vs Stanley Black & Decker, Inc.

Parker-Hannifin Corporation and Stanley Black & Decker, Inc.: A Comprehensive Revenue Analysis
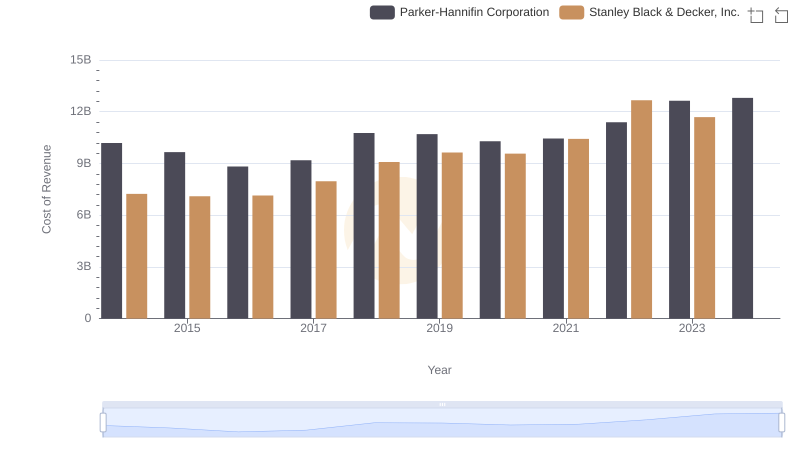
Analyzing Cost of Revenue: Parker-Hannifin Corporation and Stanley Black & Decker, Inc.
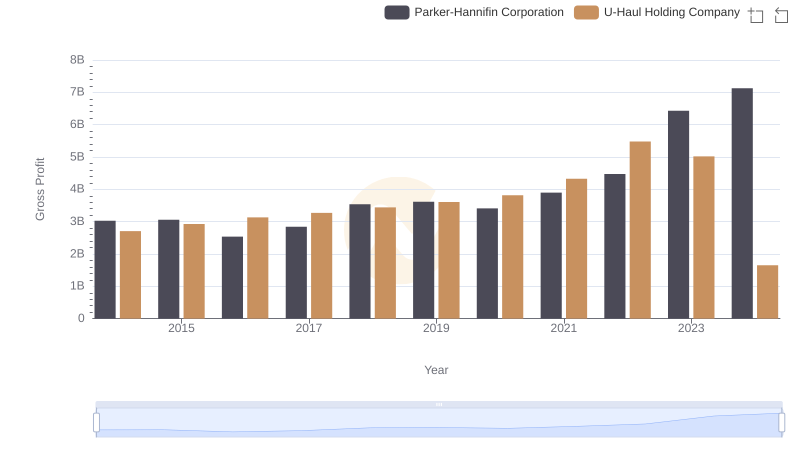
Gross Profit Trends Compared: Parker-Hannifin Corporation vs U-Haul Holding Company
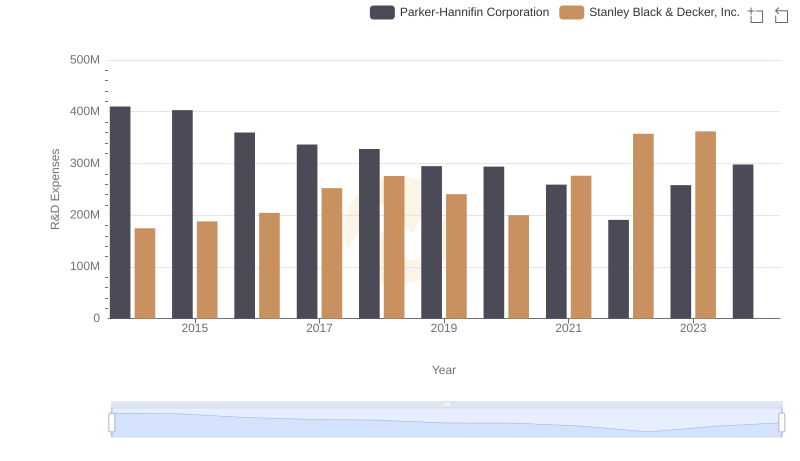
Parker-Hannifin Corporation or Stanley Black & Decker, Inc.: Who Invests More in Innovation?

Parker-Hannifin Corporation vs Stanley Black & Decker, Inc.: In-Depth EBITDA Performance Comparison