| __timestamp | Comfort Systems USA, Inc. | Parker-Hannifin Corporation |
|---|---|---|
| Wednesday, January 1, 2014 | 63455000 | 1832903000 |
| Thursday, January 1, 2015 | 112580000 | 1861551000 |
| Friday, January 1, 2016 | 126974000 | 1558088000 |
| Sunday, January 1, 2017 | 137151000 | 1846306000 |
| Monday, January 1, 2018 | 191982000 | 2382235000 |
| Tuesday, January 1, 2019 | 229518000 | 2513468000 |
| Wednesday, January 1, 2020 | 276904000 | 2431500000 |
| Friday, January 1, 2021 | 282506000 | 3092383000 |
| Saturday, January 1, 2022 | 352446000 | 2441242000 |
| Sunday, January 1, 2023 | 497652000 | 4071687000 |
| Monday, January 1, 2024 | 5028229000 |
Unleashing the power of data
In the ever-evolving landscape of industrial and comfort systems, Parker-Hannifin Corporation and Comfort Systems USA, Inc. have emerged as formidable players. Over the past decade, Parker-Hannifin has consistently demonstrated robust growth, with its EBITDA soaring by approximately 122% from 2014 to 2023. This growth trajectory underscores its strategic prowess in the industrial sector.
Conversely, Comfort Systems USA, Inc. has shown a remarkable 684% increase in EBITDA over the same period, reflecting its dynamic adaptation to the comfort systems market. Notably, 2023 marked a significant milestone for both companies, with Parker-Hannifin achieving its highest EBITDA yet, while Comfort Systems USA, Inc. also reached unprecedented heights.
While 2024 data for Comfort Systems USA, Inc. remains elusive, Parker-Hannifin continues to set new records, hinting at a promising future. This analysis offers a glimpse into the strategic maneuvers and market dynamics shaping these industry leaders.
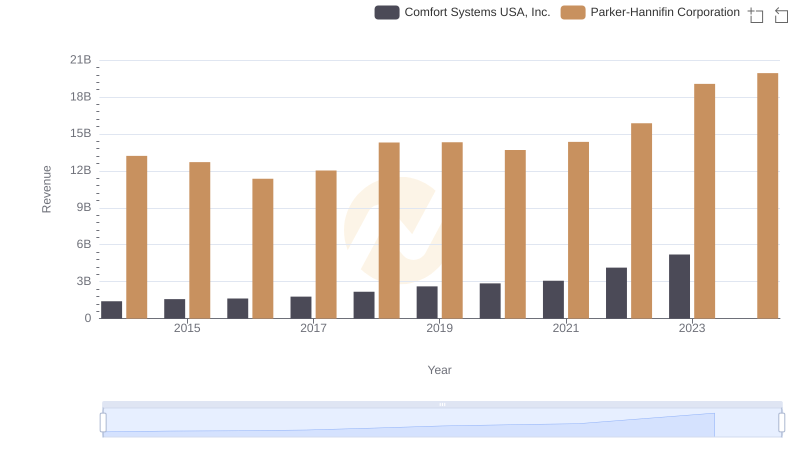
Revenue Insights: Parker-Hannifin Corporation and Comfort Systems USA, Inc. Performance Compared
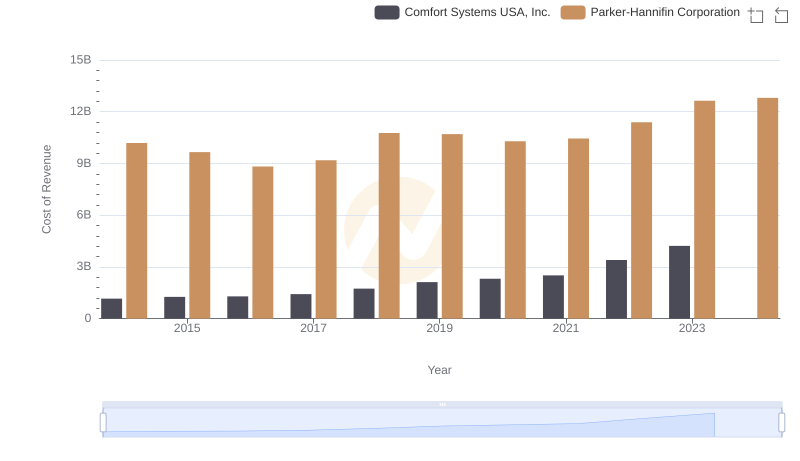
Cost of Revenue Comparison: Parker-Hannifin Corporation vs Comfort Systems USA, Inc.

Parker-Hannifin Corporation vs Comfort Systems USA, Inc.: A Gross Profit Performance Breakdown
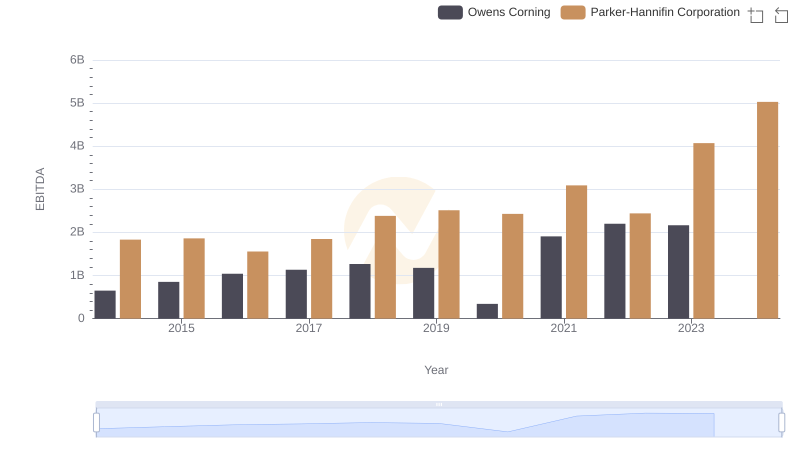
Parker-Hannifin Corporation and Owens Corning: A Detailed Examination of EBITDA Performance
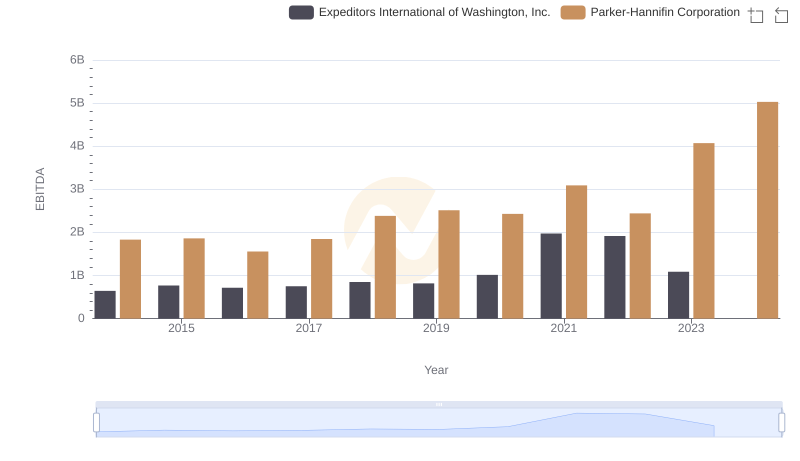
A Professional Review of EBITDA: Parker-Hannifin Corporation Compared to Expeditors International of Washington, Inc.
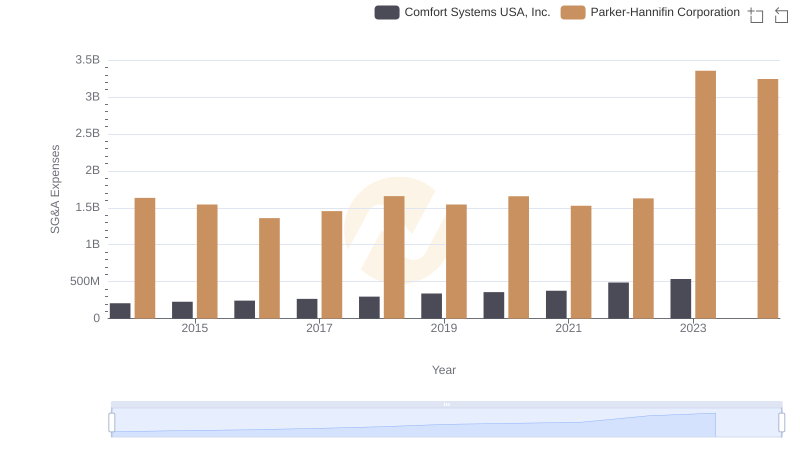
Operational Costs Compared: SG&A Analysis of Parker-Hannifin Corporation and Comfort Systems USA, Inc.
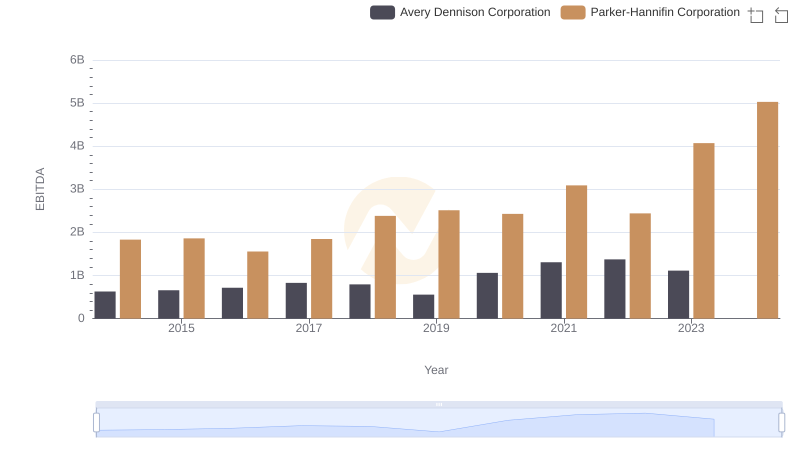
EBITDA Metrics Evaluated: Parker-Hannifin Corporation vs Avery Dennison Corporation
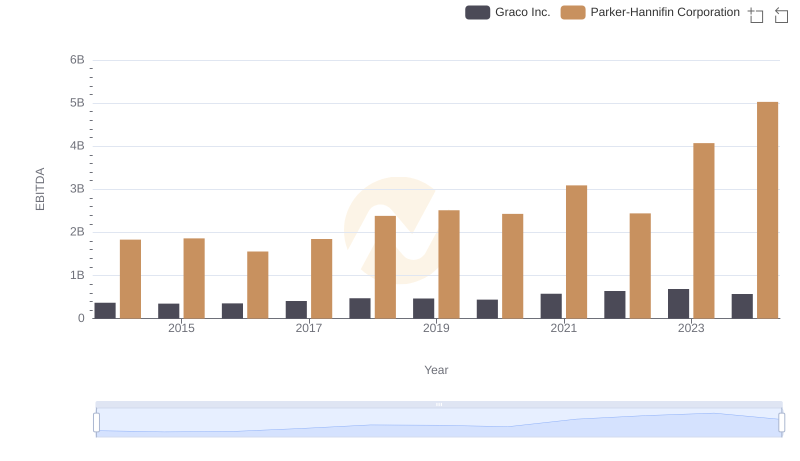
EBITDA Analysis: Evaluating Parker-Hannifin Corporation Against Graco Inc.
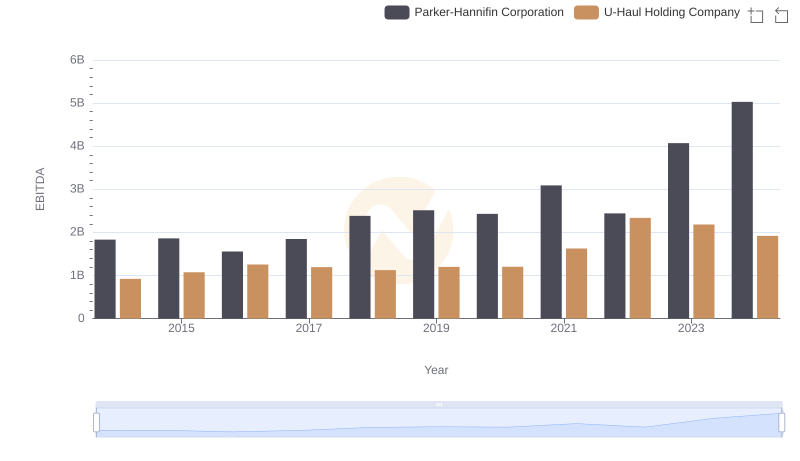
EBITDA Metrics Evaluated: Parker-Hannifin Corporation vs U-Haul Holding Company