| __timestamp | Parker-Hannifin Corporation | U-Haul Holding Company |
|---|---|---|
| Wednesday, January 1, 2014 | 3027744000 | 2707982000 |
| Thursday, January 1, 2015 | 3056499000 | 2928459000 |
| Friday, January 1, 2016 | 2537369000 | 3130666000 |
| Sunday, January 1, 2017 | 2840350000 | 3269282000 |
| Monday, January 1, 2018 | 3539551000 | 3440625000 |
| Tuesday, January 1, 2019 | 3616840000 | 3606565000 |
| Wednesday, January 1, 2020 | 3409002000 | 3814850000 |
| Friday, January 1, 2021 | 3897960000 | 4327926000 |
| Saturday, January 1, 2022 | 4474341000 | 5480162000 |
| Sunday, January 1, 2023 | 6429302000 | 5019797000 |
| Monday, January 1, 2024 | 7127790000 | 1649634000 |
Unlocking the unknown
In the ever-evolving landscape of American industry, Parker-Hannifin Corporation and U-Haul Holding Company stand as titans in their respective fields. Over the past decade, Parker-Hannifin has demonstrated a robust growth trajectory, with its gross profit surging by approximately 135% from 2014 to 2024. This growth is particularly notable in the last two years, where profits jumped by nearly 60%.
Conversely, U-Haul's journey has been more volatile. After a steady climb, reaching a peak in 2022, the company's gross profit plummeted by 70% in 2024. This stark contrast highlights the dynamic nature of the market and the challenges faced by companies in maintaining consistent growth.
These trends underscore the importance of strategic adaptability and innovation in sustaining profitability in a competitive environment.
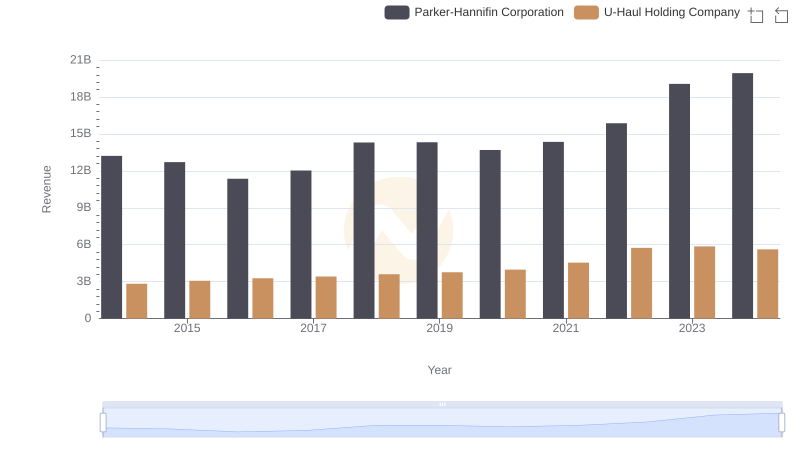
Parker-Hannifin Corporation vs U-Haul Holding Company: Annual Revenue Growth Compared
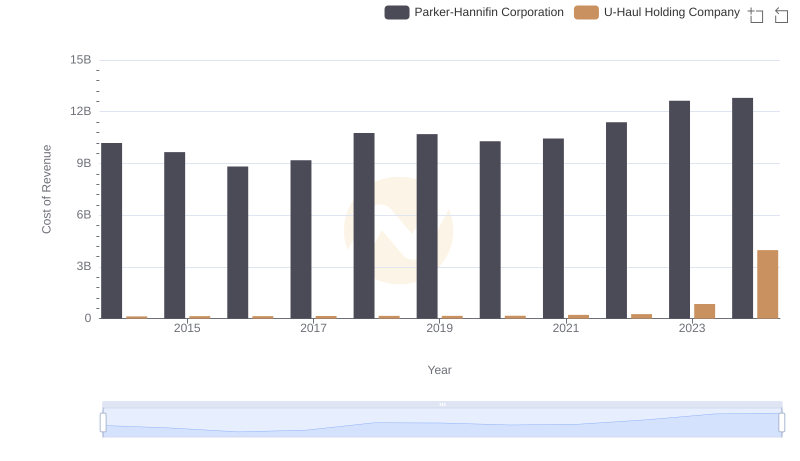
Cost Insights: Breaking Down Parker-Hannifin Corporation and U-Haul Holding Company's Expenses

Parker-Hannifin Corporation vs Comfort Systems USA, Inc.: A Gross Profit Performance Breakdown
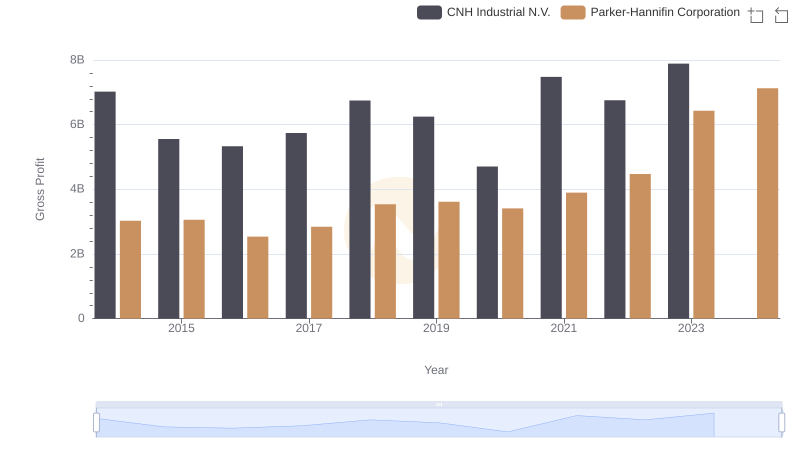
Parker-Hannifin Corporation and CNH Industrial N.V.: A Detailed Gross Profit Analysis
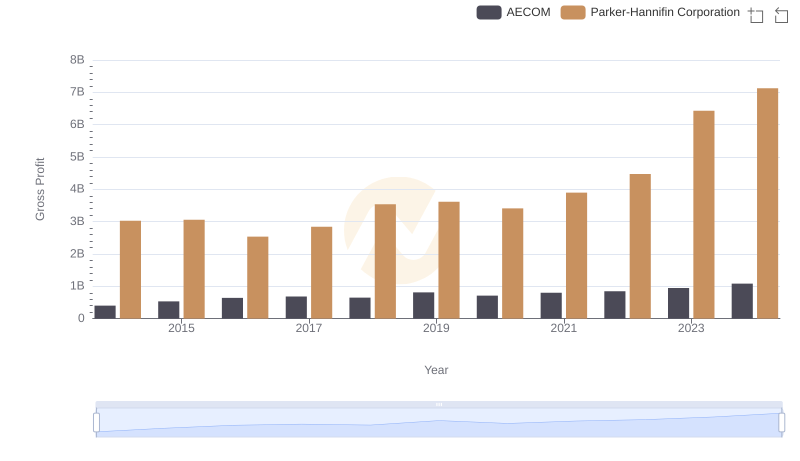
Gross Profit Comparison: Parker-Hannifin Corporation and AECOM Trends
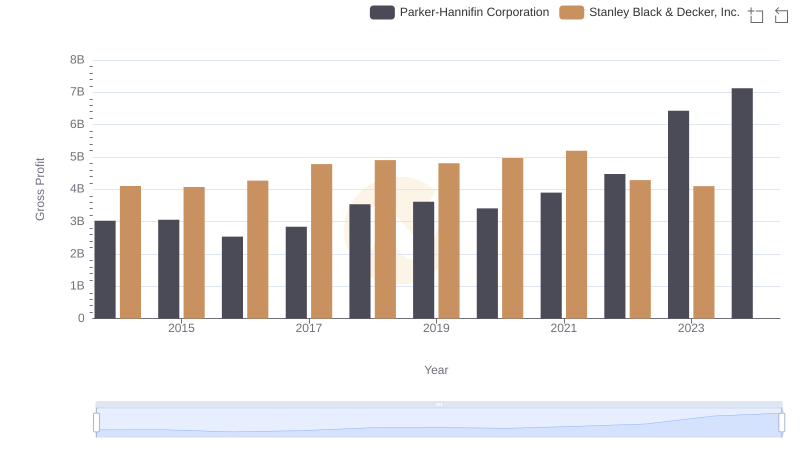
Gross Profit Comparison: Parker-Hannifin Corporation and Stanley Black & Decker, Inc. Trends
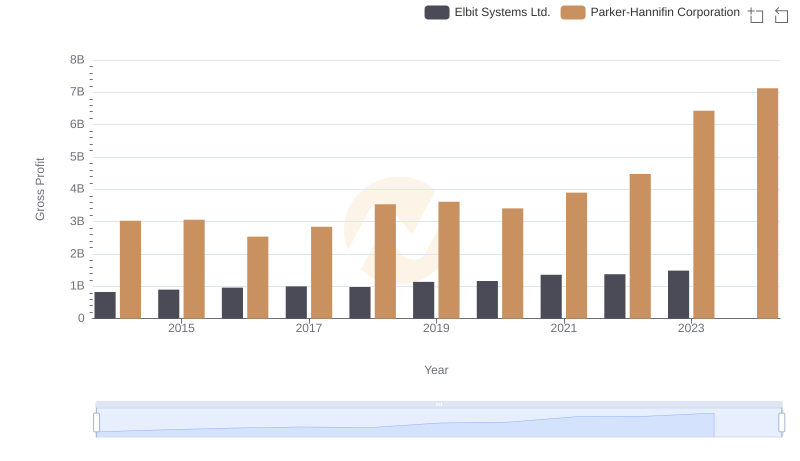
Gross Profit Trends Compared: Parker-Hannifin Corporation vs Elbit Systems Ltd.
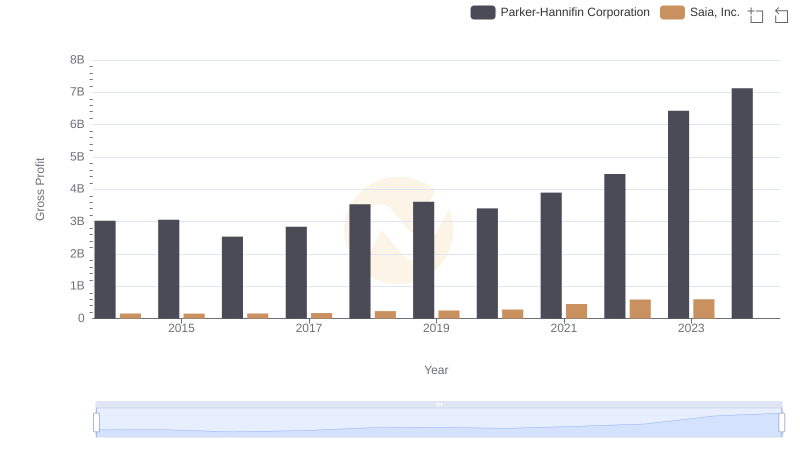
Gross Profit Trends Compared: Parker-Hannifin Corporation vs Saia, Inc.
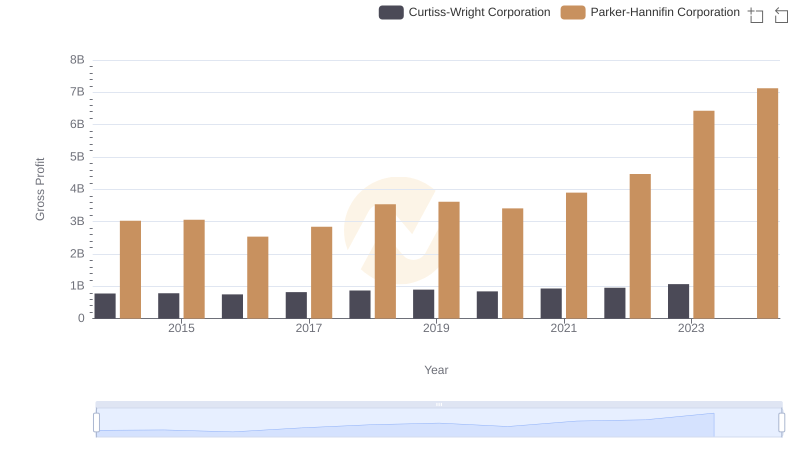
Who Generates Higher Gross Profit? Parker-Hannifin Corporation or Curtiss-Wright Corporation
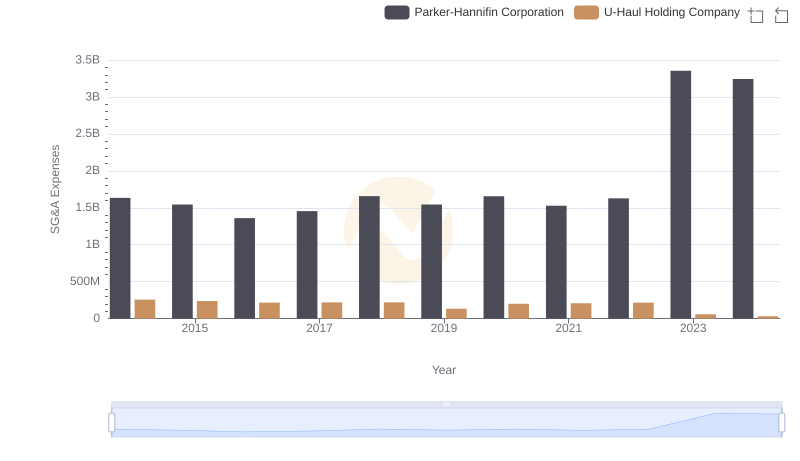
Operational Costs Compared: SG&A Analysis of Parker-Hannifin Corporation and U-Haul Holding Company
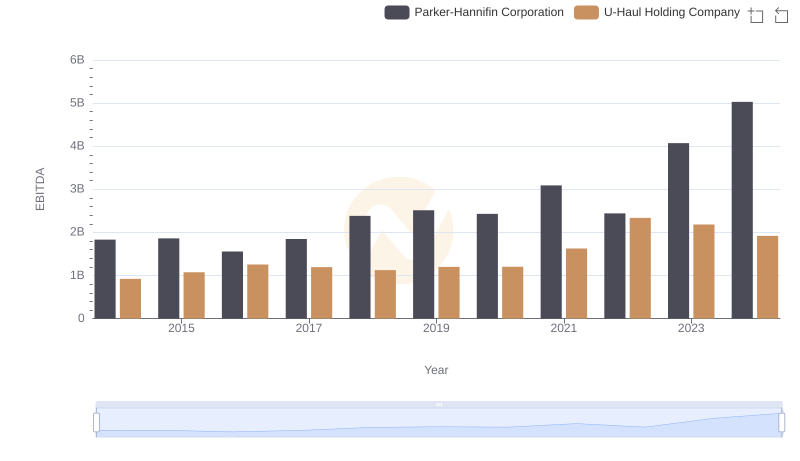
EBITDA Metrics Evaluated: Parker-Hannifin Corporation vs U-Haul Holding Company