| __timestamp | Graco Inc. | Parker-Hannifin Corporation |
|---|---|---|
| Wednesday, January 1, 2014 | 666736000 | 3027744000 |
| Thursday, January 1, 2015 | 684700000 | 3056499000 |
| Friday, January 1, 2016 | 708239000 | 2537369000 |
| Sunday, January 1, 2017 | 793049000 | 2840350000 |
| Monday, January 1, 2018 | 882539000 | 3539551000 |
| Tuesday, January 1, 2019 | 859756000 | 3616840000 |
| Wednesday, January 1, 2020 | 854937000 | 3409002000 |
| Friday, January 1, 2021 | 1033949000 | 3897960000 |
| Saturday, January 1, 2022 | 1057439000 | 4474341000 |
| Sunday, January 1, 2023 | 1161021000 | 6429302000 |
| Monday, January 1, 2024 | 1122461000 | 7127790000 |
In pursuit of knowledge
In the competitive landscape of industrial manufacturing, Parker-Hannifin Corporation and Graco Inc. have showcased remarkable financial trajectories over the past decade. From 2014 to 2024, Parker-Hannifin's gross profit surged by approximately 135%, reflecting its robust market strategies and operational efficiencies. In contrast, Graco Inc. experienced a steady growth of around 68% during the same period, underscoring its consistent performance in the industry.
Parker-Hannifin's gross profit peaked in 2024, reaching over 7 billion, a testament to its strategic expansions and innovations. Meanwhile, Graco Inc. achieved its highest gross profit in 2023, with a slight dip in 2024, indicating potential market challenges or strategic shifts.
The data highlights Parker-Hannifin's aggressive growth strategy, outpacing Graco Inc. by a significant margin. This analysis provides valuable insights for investors and industry analysts monitoring these industrial giants.
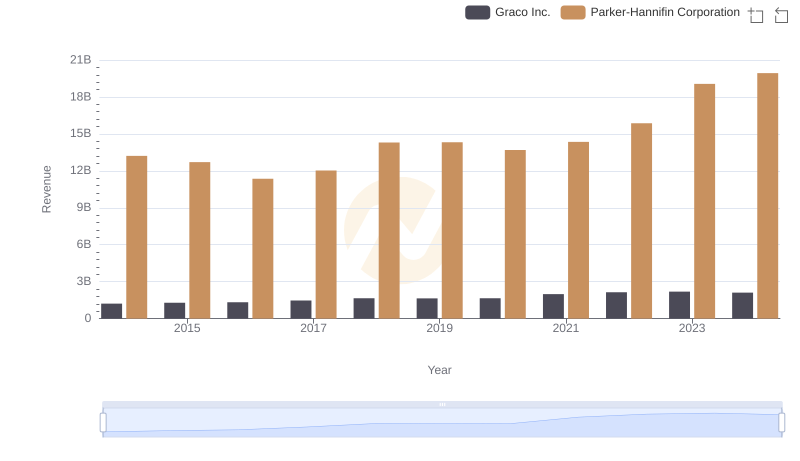
Comparing Revenue Performance: Parker-Hannifin Corporation or Graco Inc.?
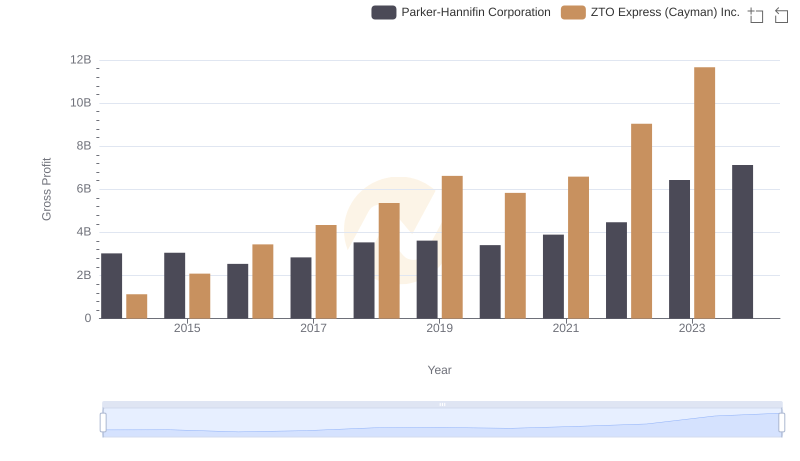
Who Generates Higher Gross Profit? Parker-Hannifin Corporation or ZTO Express (Cayman) Inc.
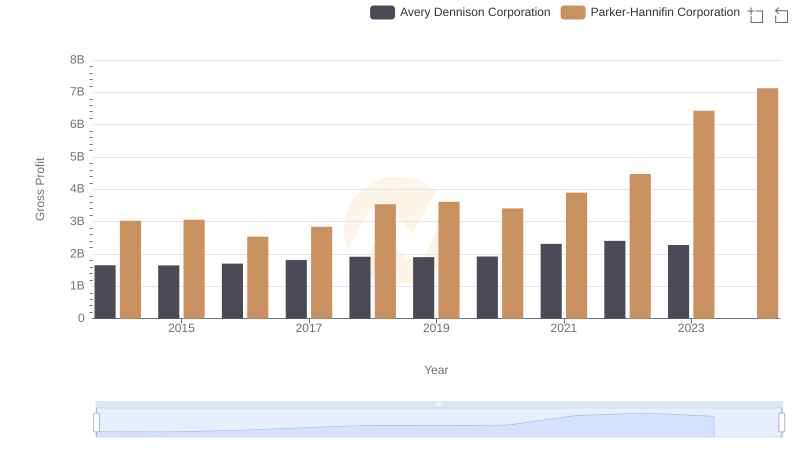
Gross Profit Comparison: Parker-Hannifin Corporation and Avery Dennison Corporation Trends
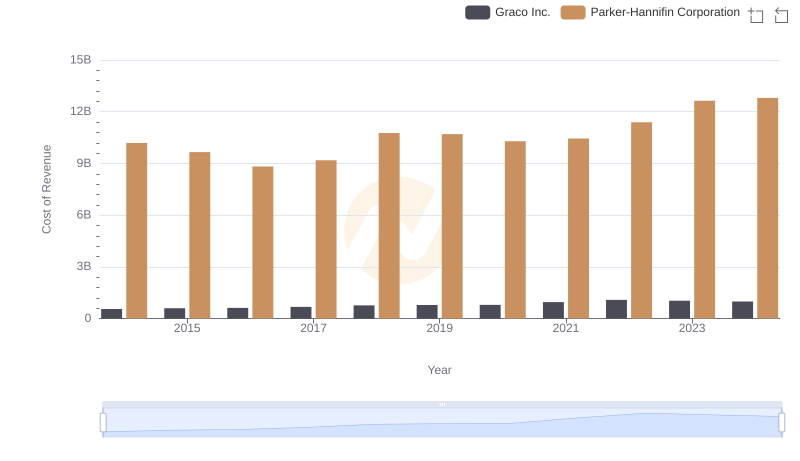
Cost of Revenue: Key Insights for Parker-Hannifin Corporation and Graco Inc.
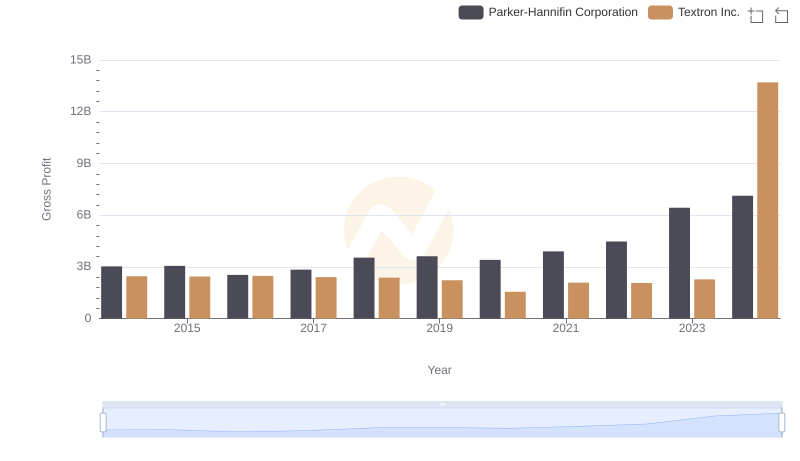
Who Generates Higher Gross Profit? Parker-Hannifin Corporation or Textron Inc.

Parker-Hannifin Corporation vs Comfort Systems USA, Inc.: A Gross Profit Performance Breakdown
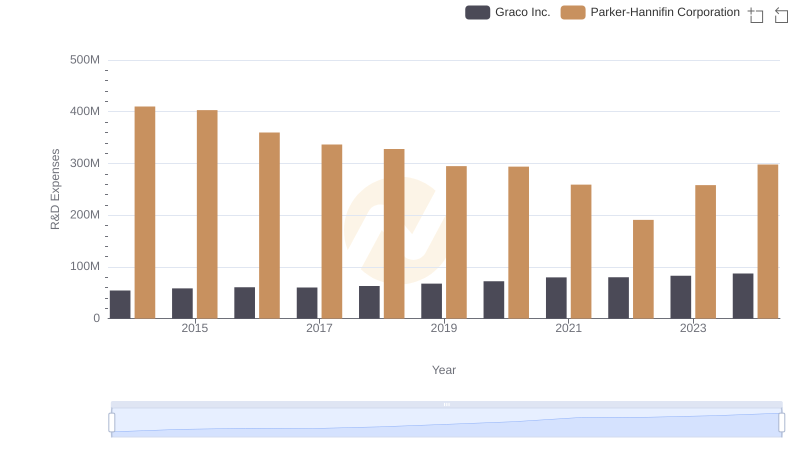
Research and Development Investment: Parker-Hannifin Corporation vs Graco Inc.
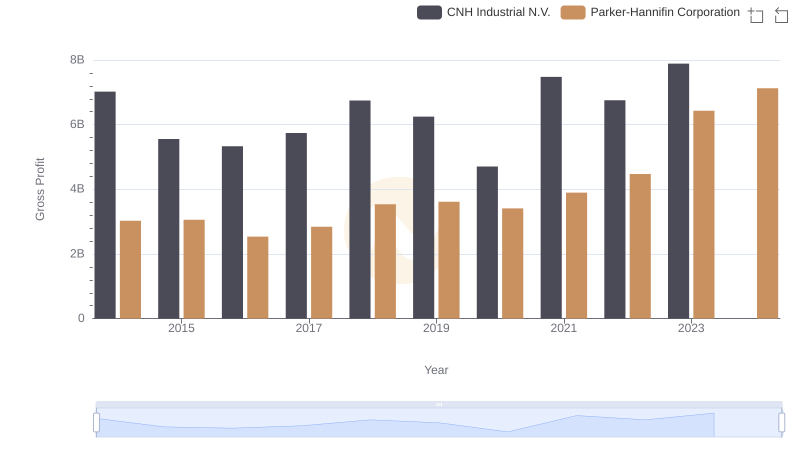
Parker-Hannifin Corporation and CNH Industrial N.V.: A Detailed Gross Profit Analysis
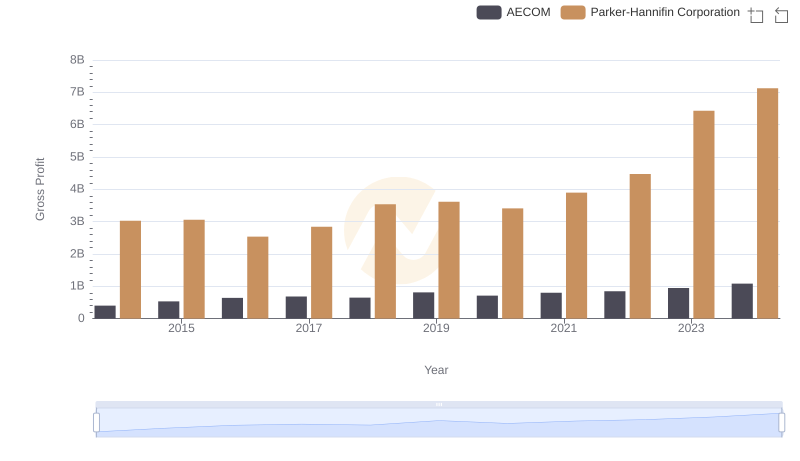
Gross Profit Comparison: Parker-Hannifin Corporation and AECOM Trends
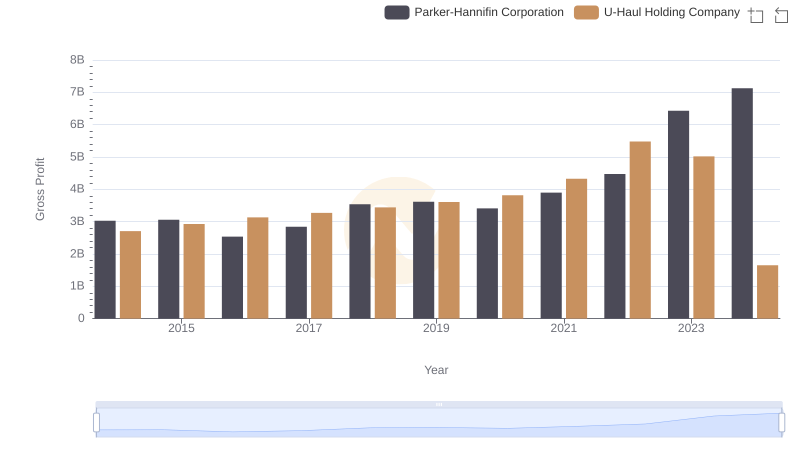
Gross Profit Trends Compared: Parker-Hannifin Corporation vs U-Haul Holding Company
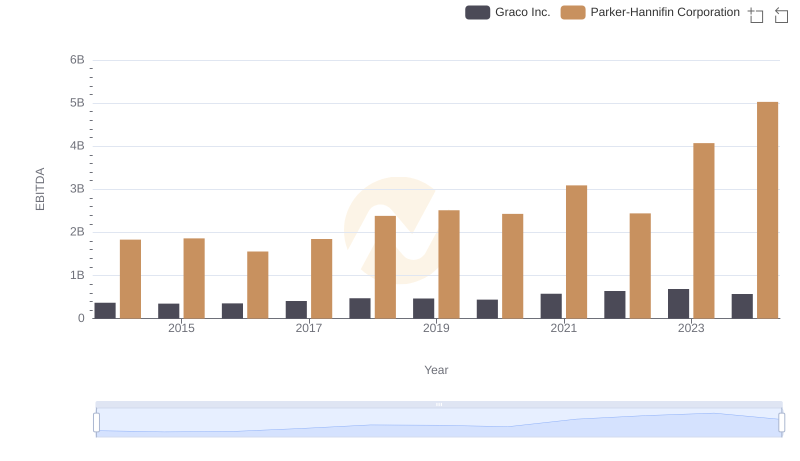
EBITDA Analysis: Evaluating Parker-Hannifin Corporation Against Graco Inc.