| __timestamp | Comfort Systems USA, Inc. | Parker-Hannifin Corporation |
|---|---|---|
| Wednesday, January 1, 2014 | 1161024000 | 10188227000 |
| Thursday, January 1, 2015 | 1262390000 | 9655245000 |
| Friday, January 1, 2016 | 1290331000 | 8823384000 |
| Sunday, January 1, 2017 | 1421641000 | 9188962000 |
| Monday, January 1, 2018 | 1736600000 | 10762841000 |
| Tuesday, January 1, 2019 | 2113334000 | 10703484000 |
| Wednesday, January 1, 2020 | 2309676000 | 10286518000 |
| Friday, January 1, 2021 | 2510429000 | 10449680000 |
| Saturday, January 1, 2022 | 3398756000 | 11387267000 |
| Sunday, January 1, 2023 | 4216251000 | 12635892000 |
| Monday, January 1, 2024 | 12801816000 |
Unveiling the hidden dimensions of data
In the ever-evolving landscape of industrial and commercial services, Parker-Hannifin Corporation and Comfort Systems USA, Inc. stand as significant players. Over the past decade, Parker-Hannifin has consistently maintained a higher cost of revenue, peaking at approximately $12.6 billion in 2023, reflecting its expansive operations and market reach. In contrast, Comfort Systems USA, Inc. has shown remarkable growth, with its cost of revenue surging by over 260% from 2014 to 2023, reaching around $4.2 billion. This growth trajectory highlights Comfort Systems' strategic expansion and increasing market demand. Notably, the data for 2024 is incomplete, leaving room for speculation on future trends. As these companies navigate the complexities of their industries, their financial strategies and market adaptations will be crucial in shaping their cost structures and competitive positions.
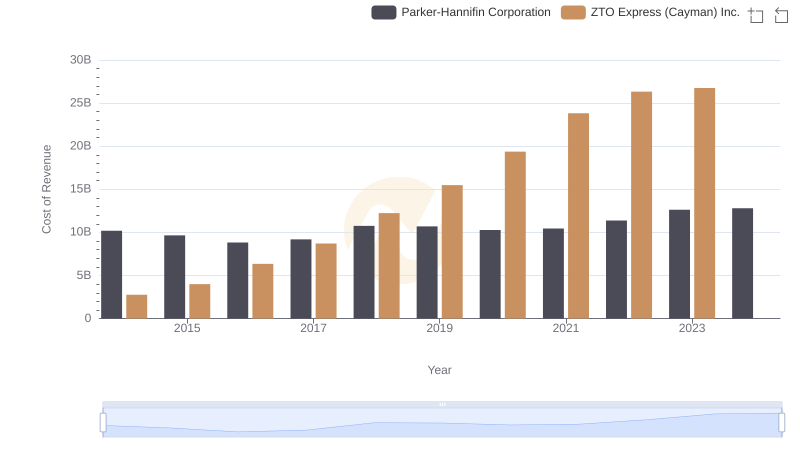
Cost of Revenue Trends: Parker-Hannifin Corporation vs ZTO Express (Cayman) Inc.
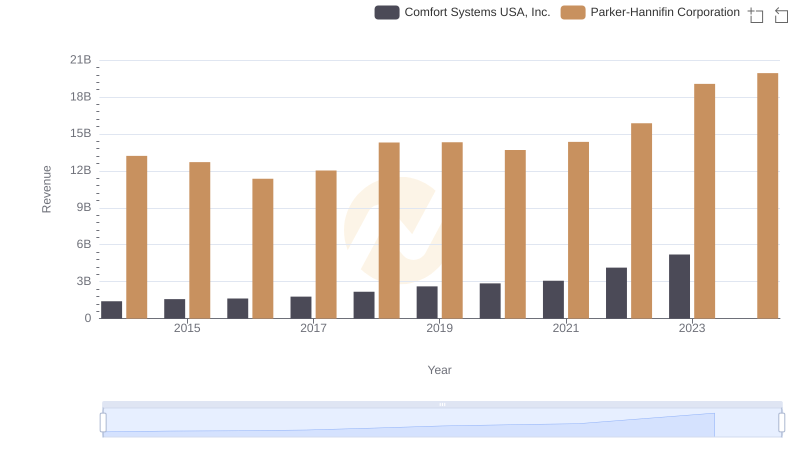
Revenue Insights: Parker-Hannifin Corporation and Comfort Systems USA, Inc. Performance Compared
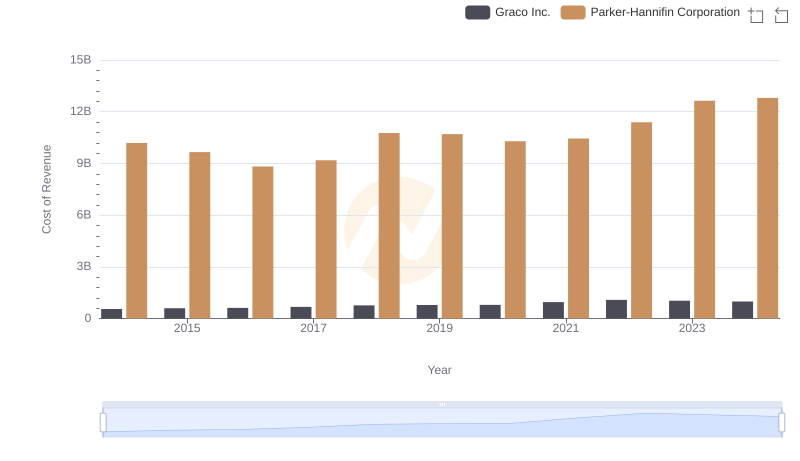
Cost of Revenue: Key Insights for Parker-Hannifin Corporation and Graco Inc.
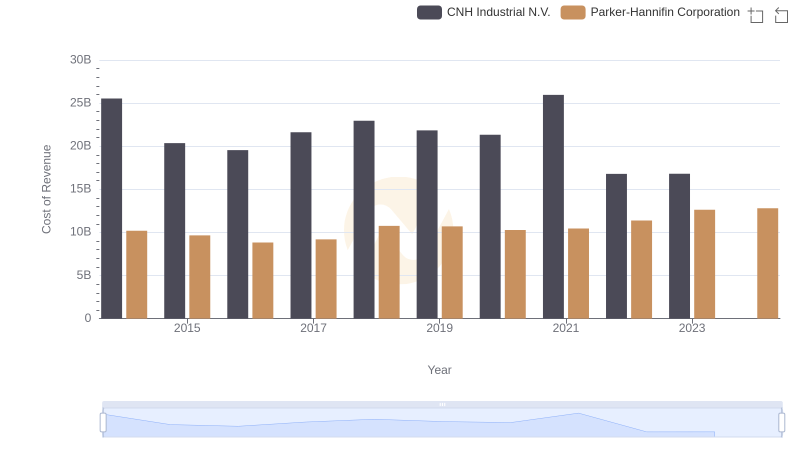
Analyzing Cost of Revenue: Parker-Hannifin Corporation and CNH Industrial N.V.
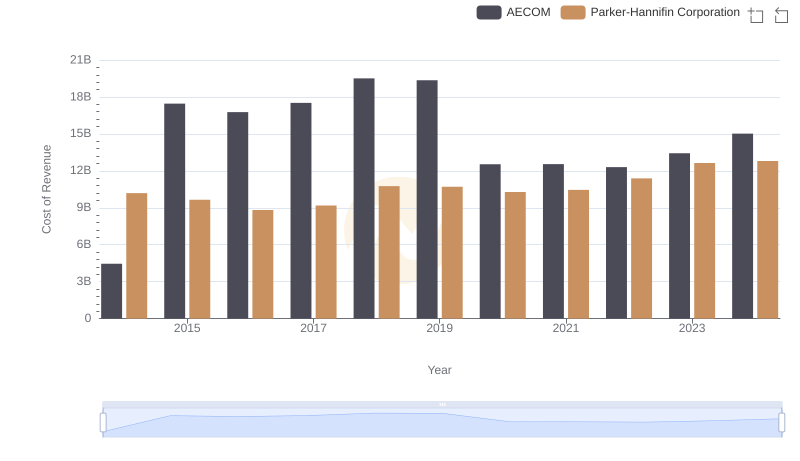
Comparing Cost of Revenue Efficiency: Parker-Hannifin Corporation vs AECOM
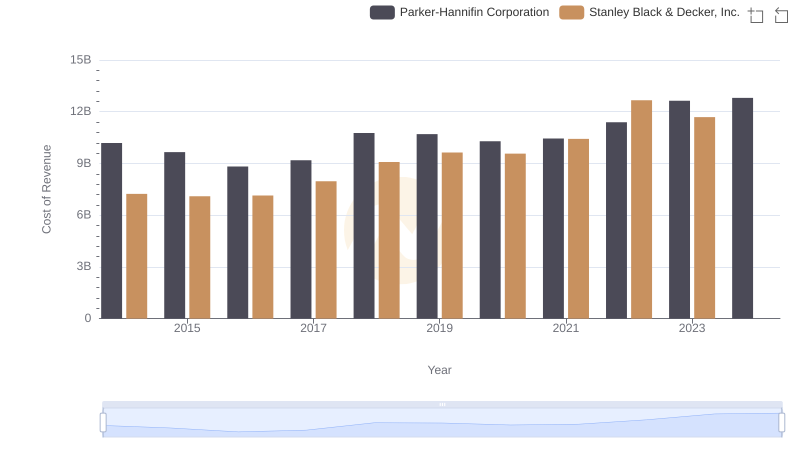
Analyzing Cost of Revenue: Parker-Hannifin Corporation and Stanley Black & Decker, Inc.
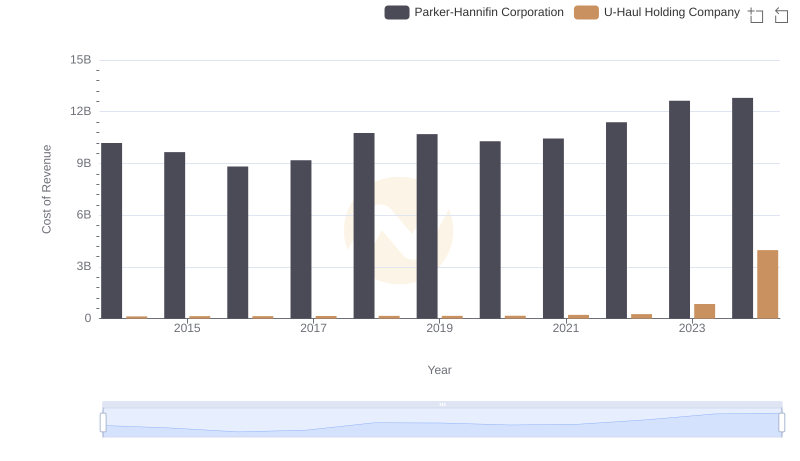
Cost Insights: Breaking Down Parker-Hannifin Corporation and U-Haul Holding Company's Expenses
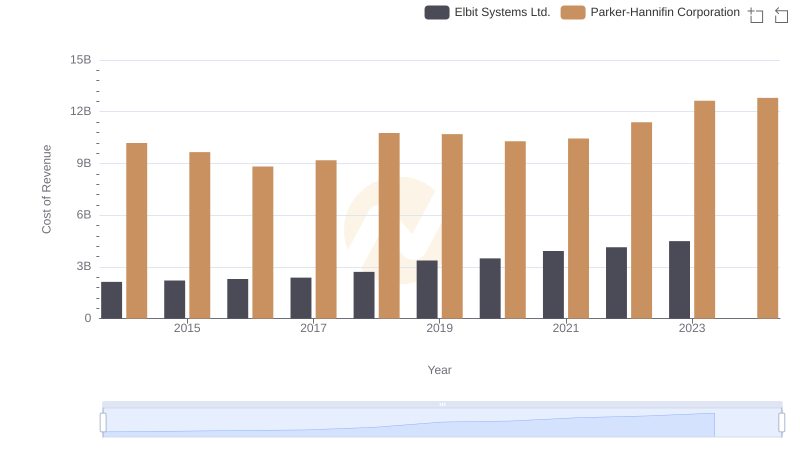
Cost of Revenue Trends: Parker-Hannifin Corporation vs Elbit Systems Ltd.

Parker-Hannifin Corporation vs Comfort Systems USA, Inc.: A Gross Profit Performance Breakdown
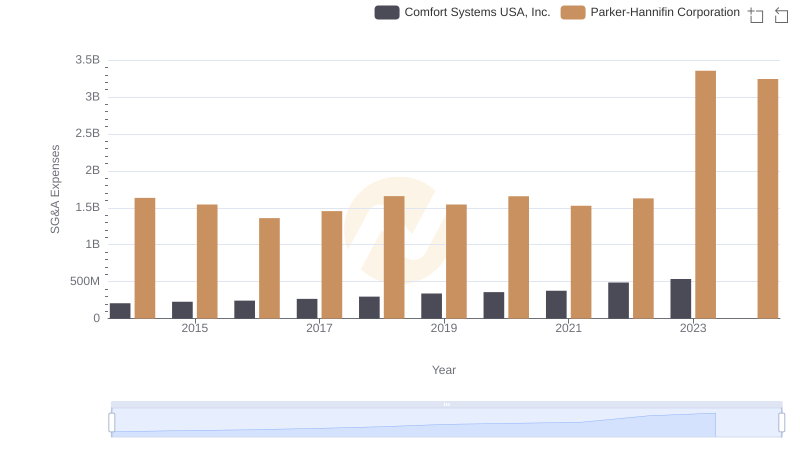
Operational Costs Compared: SG&A Analysis of Parker-Hannifin Corporation and Comfort Systems USA, Inc.
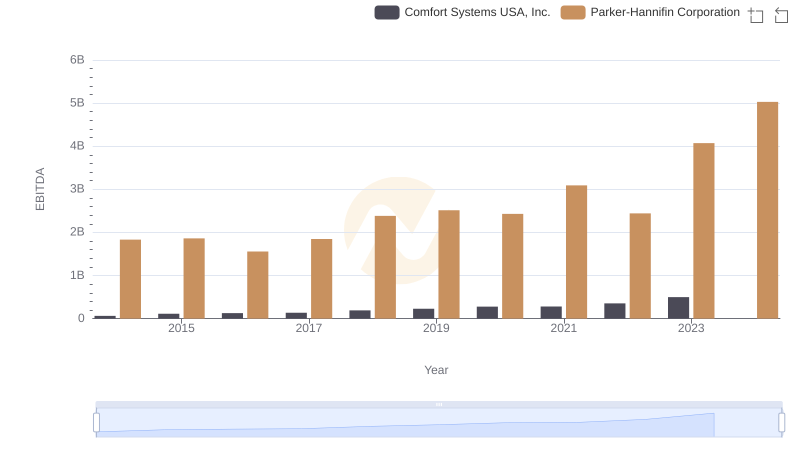
Parker-Hannifin Corporation and Comfort Systems USA, Inc.: A Detailed Examination of EBITDA Performance