| __timestamp | CNH Industrial N.V. | Parker-Hannifin Corporation |
|---|---|---|
| Wednesday, January 1, 2014 | 2591000000 | 1832903000 |
| Thursday, January 1, 2015 | 1757000000 | 1861551000 |
| Friday, January 1, 2016 | 1063000000 | 1558088000 |
| Sunday, January 1, 2017 | 1715000000 | 1846306000 |
| Monday, January 1, 2018 | 2339000000 | 2382235000 |
| Tuesday, January 1, 2019 | 2077000000 | 2513468000 |
| Wednesday, January 1, 2020 | 807000000 | 2431500000 |
| Friday, January 1, 2021 | 2650000000 | 3092383000 |
| Saturday, January 1, 2022 | 3447000000 | 2441242000 |
| Sunday, January 1, 2023 | 5549000000 | 4071687000 |
| Monday, January 1, 2024 | 5028229000 |
Unveiling the hidden dimensions of data
In the ever-evolving landscape of industrial giants, Parker-Hannifin Corporation and CNH Industrial N.V. have showcased remarkable financial trajectories over the past decade. From 2014 to 2023, Parker-Hannifin's EBITDA grew by an impressive 122%, peaking in 2023. Meanwhile, CNH Industrial experienced a staggering 114% increase, with a notable surge in 2023, marking its highest EBITDA in the period.
This data underscores the resilience and strategic prowess of these industrial titans, navigating through economic ebbs and flows.
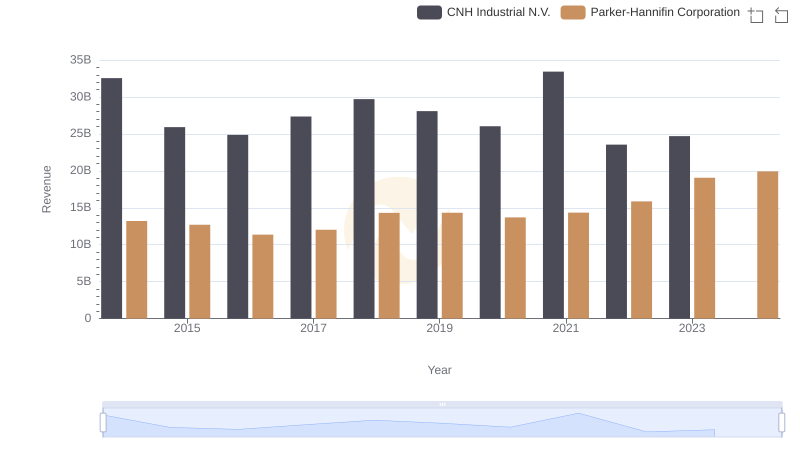
Breaking Down Revenue Trends: Parker-Hannifin Corporation vs CNH Industrial N.V.
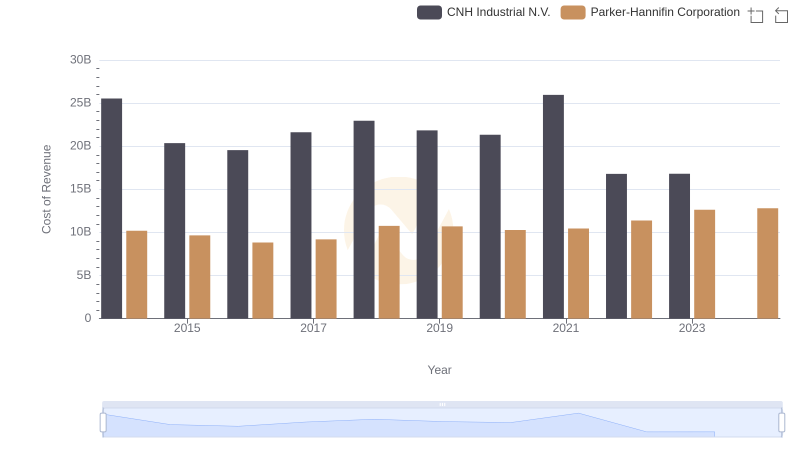
Analyzing Cost of Revenue: Parker-Hannifin Corporation and CNH Industrial N.V.
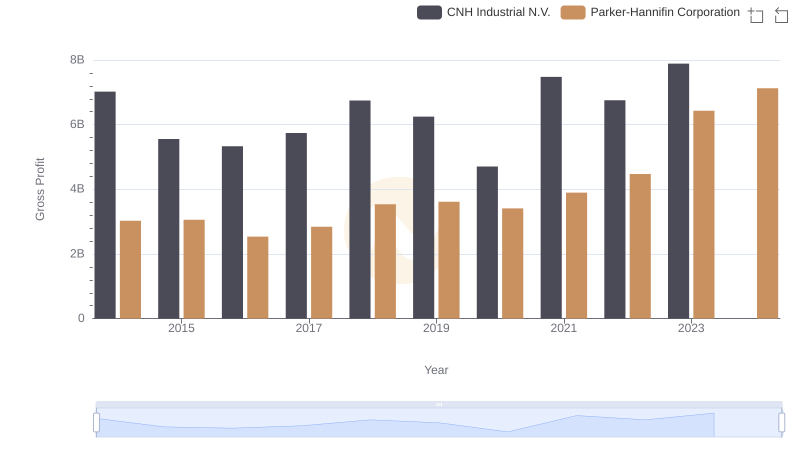
Parker-Hannifin Corporation and CNH Industrial N.V.: A Detailed Gross Profit Analysis
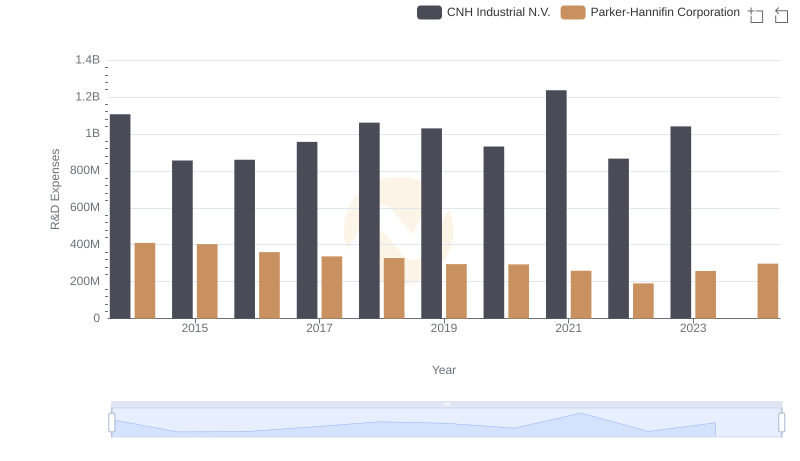
Parker-Hannifin Corporation vs CNH Industrial N.V.: Strategic Focus on R&D Spending
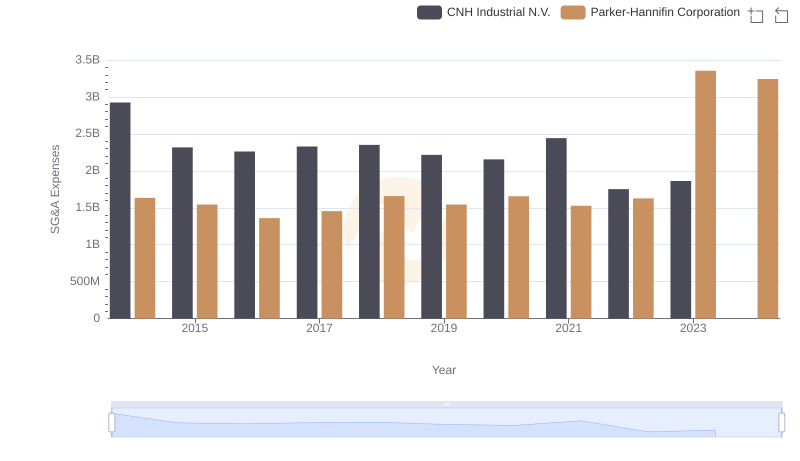
Who Optimizes SG&A Costs Better? Parker-Hannifin Corporation or CNH Industrial N.V.
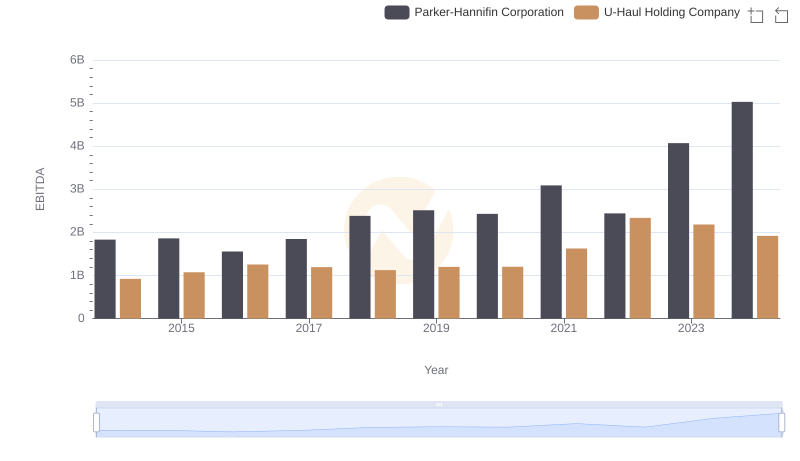
EBITDA Metrics Evaluated: Parker-Hannifin Corporation vs U-Haul Holding Company
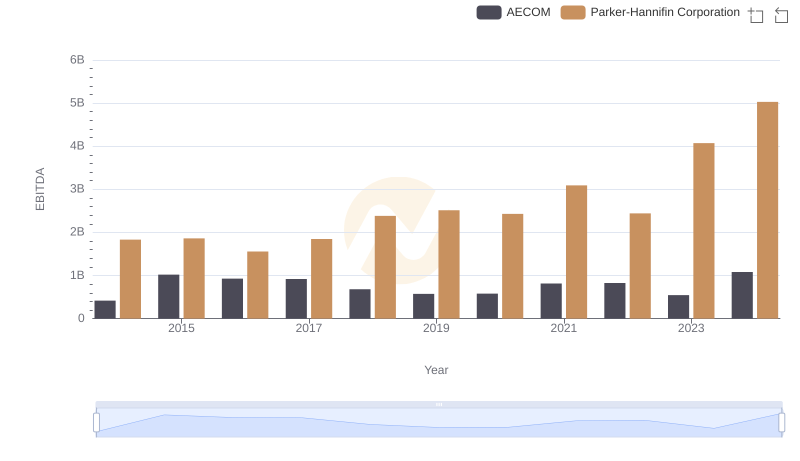
A Professional Review of EBITDA: Parker-Hannifin Corporation Compared to AECOM
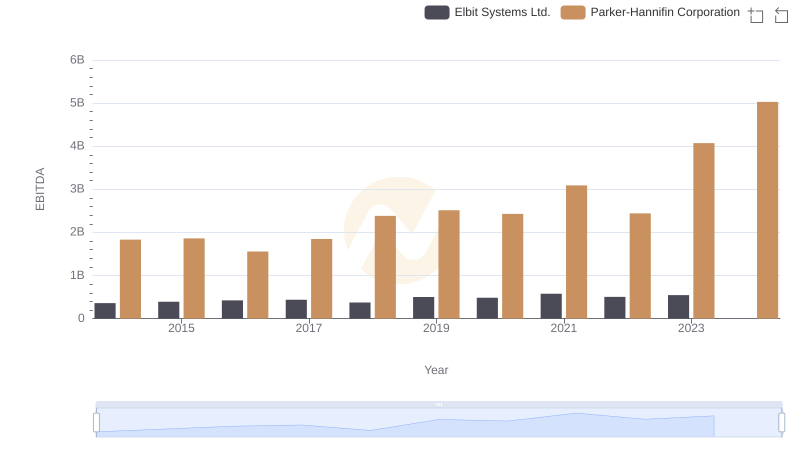
Comprehensive EBITDA Comparison: Parker-Hannifin Corporation vs Elbit Systems Ltd.
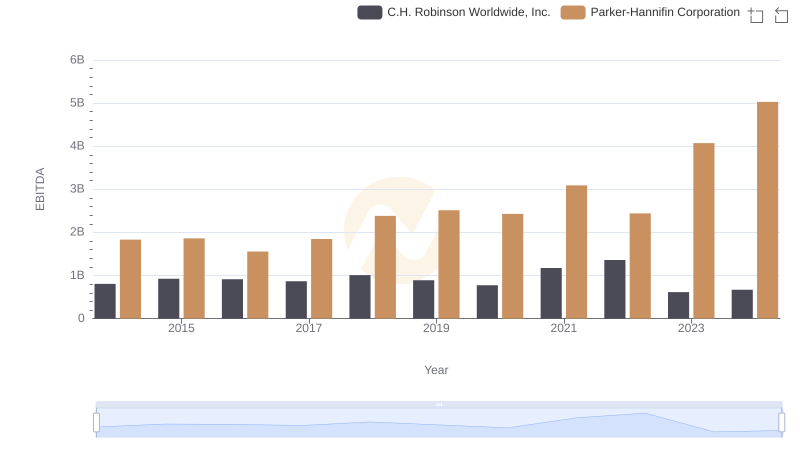
A Side-by-Side Analysis of EBITDA: Parker-Hannifin Corporation and C.H. Robinson Worldwide, Inc.
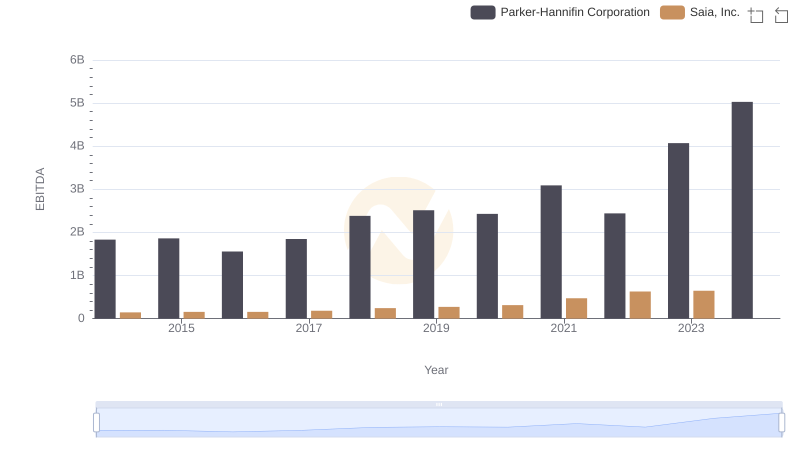
Parker-Hannifin Corporation vs Saia, Inc.: In-Depth EBITDA Performance Comparison
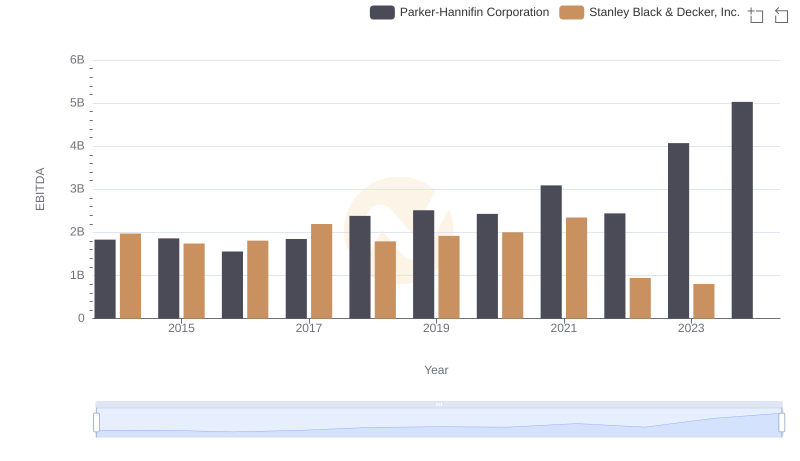
Parker-Hannifin Corporation vs Stanley Black & Decker, Inc.: In-Depth EBITDA Performance Comparison