| __timestamp | CNH Industrial N.V. | Parker-Hannifin Corporation |
|---|---|---|
| Wednesday, January 1, 2014 | 32555000000 | 13215971000 |
| Thursday, January 1, 2015 | 25912000000 | 12711744000 |
| Friday, January 1, 2016 | 24872000000 | 11360753000 |
| Sunday, January 1, 2017 | 27361000000 | 12029312000 |
| Monday, January 1, 2018 | 29706000000 | 14302392000 |
| Tuesday, January 1, 2019 | 28079000000 | 14320324000 |
| Wednesday, January 1, 2020 | 26032000000 | 13695520000 |
| Friday, January 1, 2021 | 33428000000 | 14347640000 |
| Saturday, January 1, 2022 | 23551000000 | 15861608000 |
| Sunday, January 1, 2023 | 24694000000 | 19065194000 |
| Monday, January 1, 2024 | 19929606000 |
Unveiling the hidden dimensions of data
In the ever-evolving landscape of industrial manufacturing, Parker-Hannifin Corporation and CNH Industrial N.V. have been pivotal players. Over the past decade, these companies have showcased contrasting revenue trajectories. From 2014 to 2023, CNH Industrial N.V. experienced a revenue decline of approximately 24%, with notable dips in 2015 and 2022. In contrast, Parker-Hannifin Corporation demonstrated resilience, achieving a remarkable 44% revenue growth over the same period, peaking in 2023.
These trends highlight the dynamic nature of the industrial sector, where adaptability and strategic foresight are crucial for sustained success.
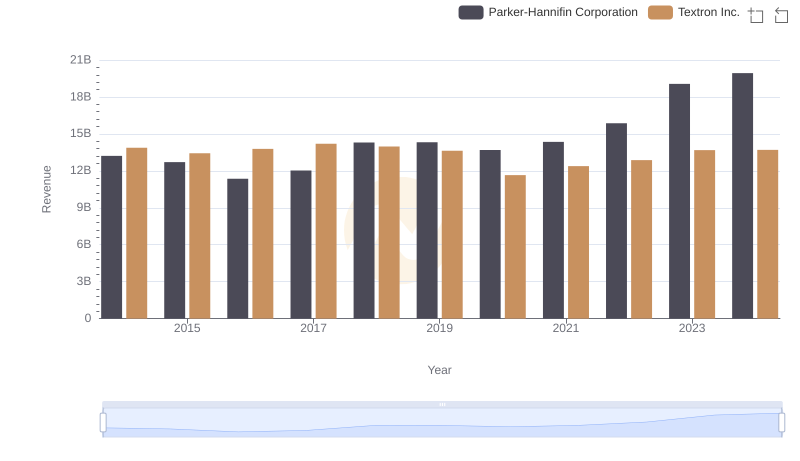
Who Generates More Revenue? Parker-Hannifin Corporation or Textron Inc.
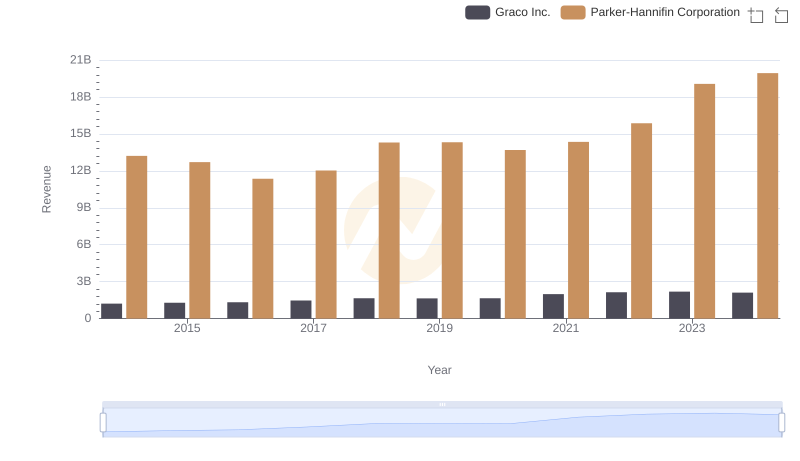
Comparing Revenue Performance: Parker-Hannifin Corporation or Graco Inc.?
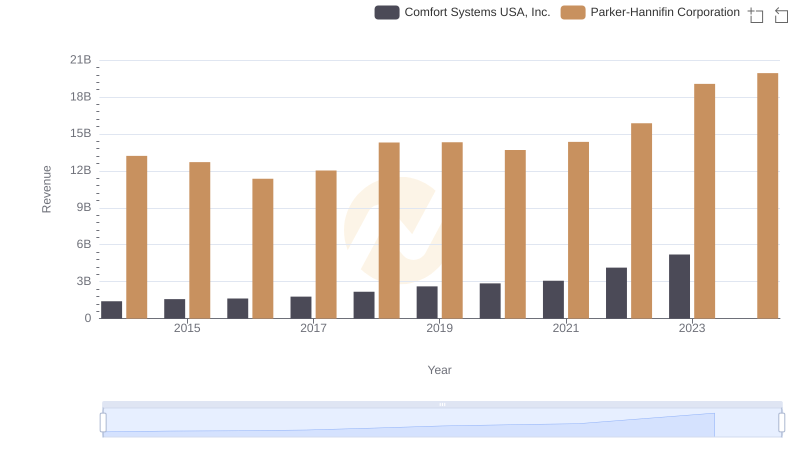
Revenue Insights: Parker-Hannifin Corporation and Comfort Systems USA, Inc. Performance Compared
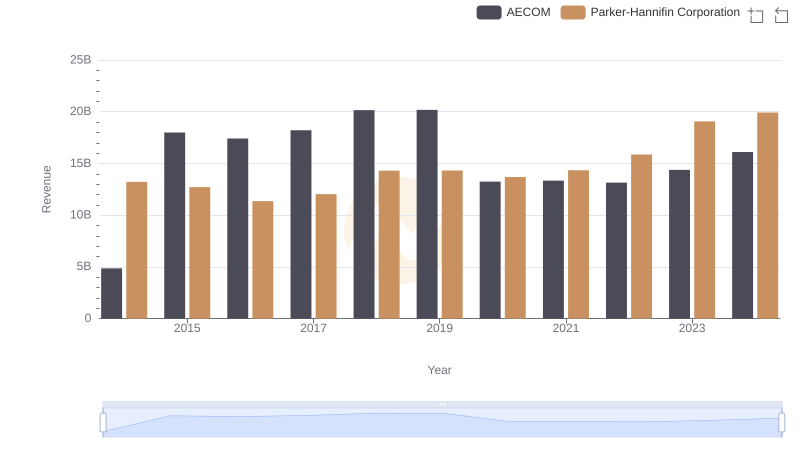
Who Generates More Revenue? Parker-Hannifin Corporation or AECOM
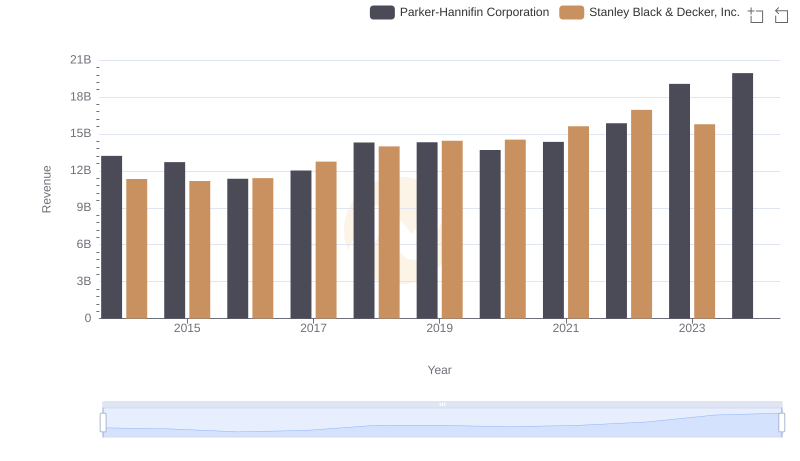
Parker-Hannifin Corporation and Stanley Black & Decker, Inc.: A Comprehensive Revenue Analysis
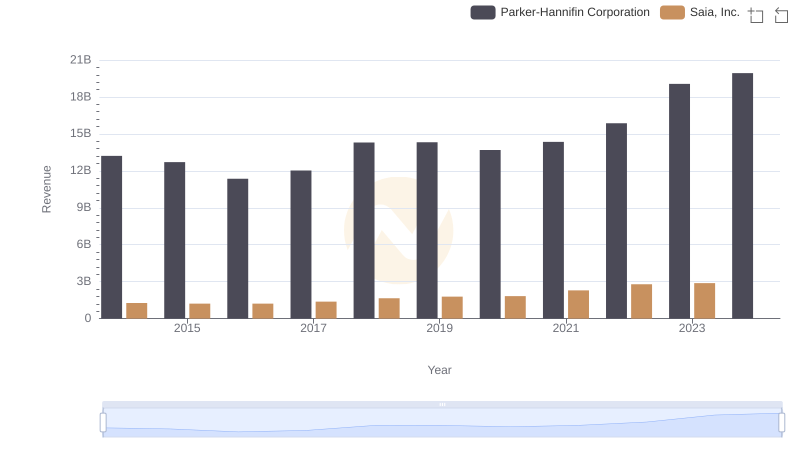
Breaking Down Revenue Trends: Parker-Hannifin Corporation vs Saia, Inc.
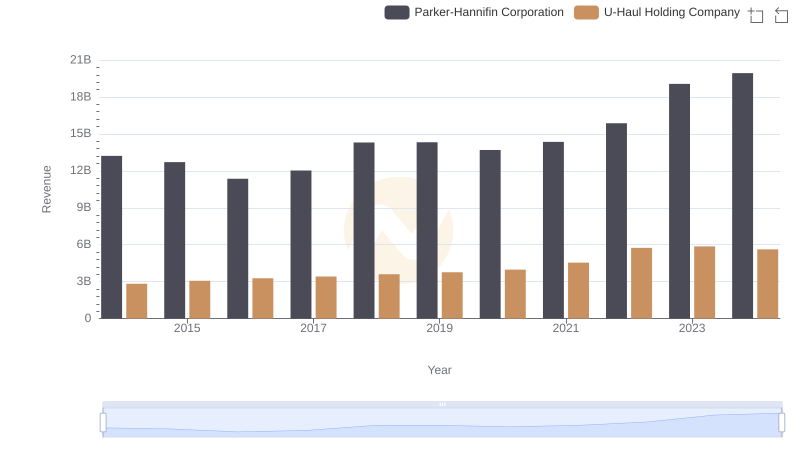
Parker-Hannifin Corporation vs U-Haul Holding Company: Annual Revenue Growth Compared
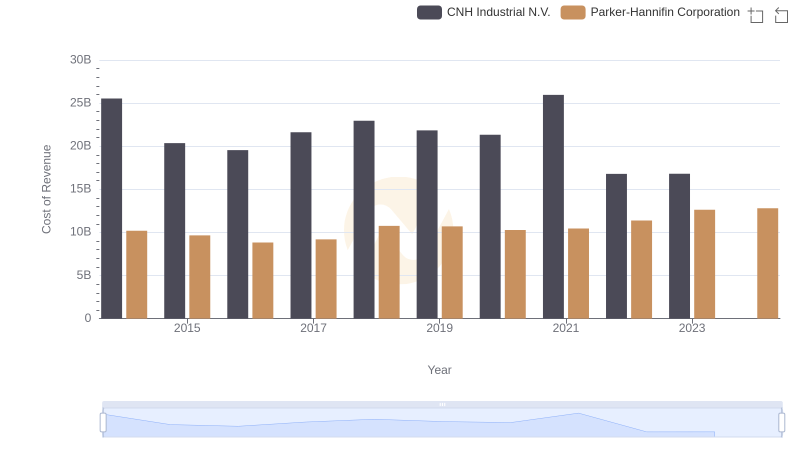
Analyzing Cost of Revenue: Parker-Hannifin Corporation and CNH Industrial N.V.
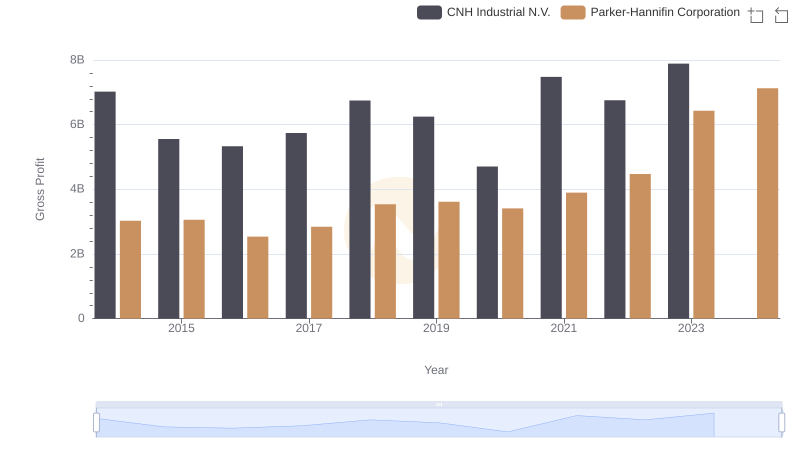
Parker-Hannifin Corporation and CNH Industrial N.V.: A Detailed Gross Profit Analysis
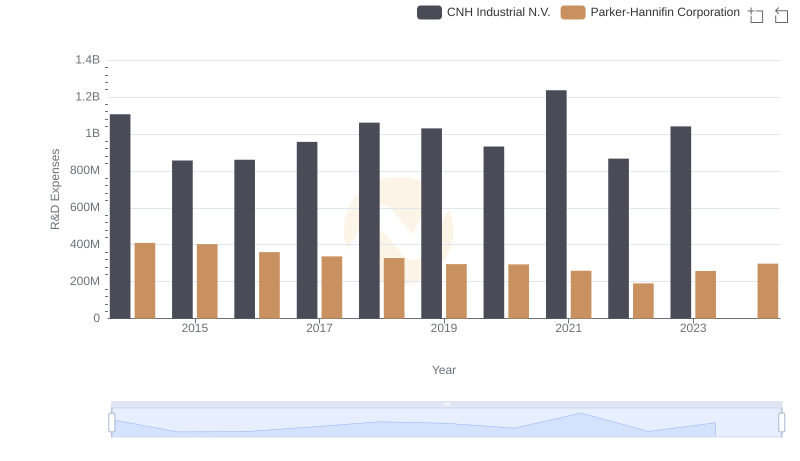
Parker-Hannifin Corporation vs CNH Industrial N.V.: Strategic Focus on R&D Spending
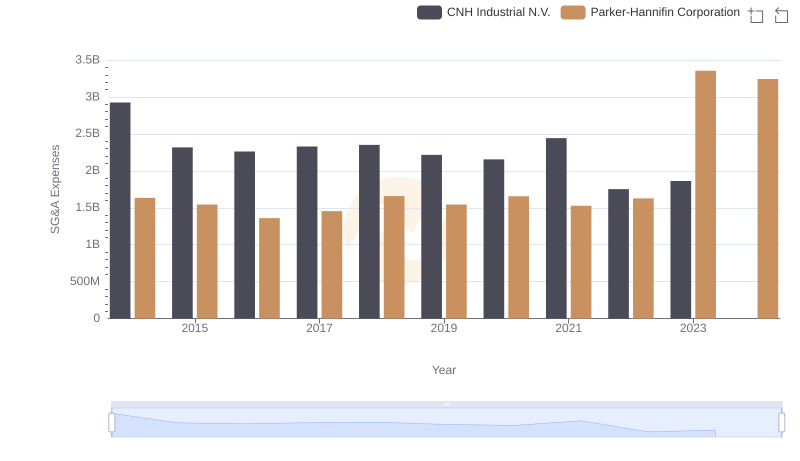
Who Optimizes SG&A Costs Better? Parker-Hannifin Corporation or CNH Industrial N.V.
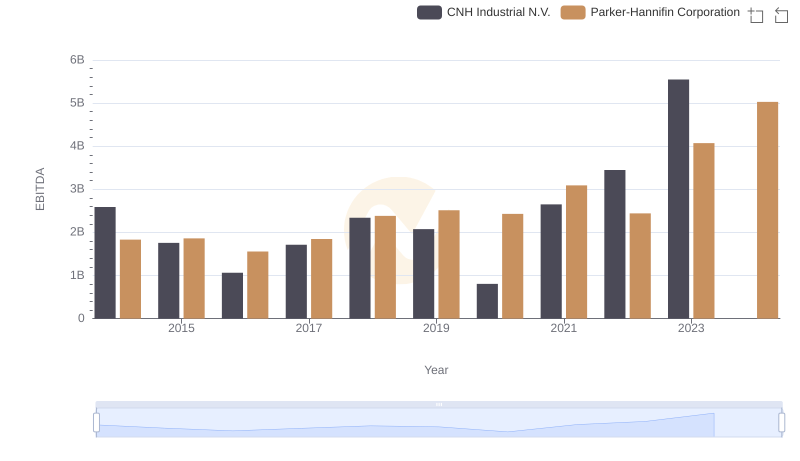
Comprehensive EBITDA Comparison: Parker-Hannifin Corporation vs CNH Industrial N.V.