| __timestamp | CNH Industrial N.V. | Parker-Hannifin Corporation |
|---|---|---|
| Wednesday, January 1, 2014 | 25534000000 | 10188227000 |
| Thursday, January 1, 2015 | 20357000000 | 9655245000 |
| Friday, January 1, 2016 | 19539000000 | 8823384000 |
| Sunday, January 1, 2017 | 21621000000 | 9188962000 |
| Monday, January 1, 2018 | 22958000000 | 10762841000 |
| Tuesday, January 1, 2019 | 21832000000 | 10703484000 |
| Wednesday, January 1, 2020 | 21327000000 | 10286518000 |
| Friday, January 1, 2021 | 25951000000 | 10449680000 |
| Saturday, January 1, 2022 | 16797000000 | 11387267000 |
| Sunday, January 1, 2023 | 16805000000 | 12635892000 |
| Monday, January 1, 2024 | 12801816000 |
Data in motion
In the competitive landscape of industrial manufacturing, understanding cost dynamics is crucial. Parker-Hannifin Corporation and CNH Industrial N.V. have been pivotal players in this arena. From 2014 to 2023, CNH Industrial's cost of revenue fluctuated significantly, peaking in 2021 with a 55% increase from its 2022 low. Meanwhile, Parker-Hannifin demonstrated a steady upward trend, culminating in a 28% rise over the decade. This divergence highlights CNH's volatile cost structure compared to Parker-Hannifin's consistent growth. Notably, 2024 data for CNH is missing, suggesting potential reporting delays or strategic shifts. As these companies navigate global challenges, their cost management strategies will be key to maintaining competitive advantage. Investors and industry analysts should watch these trends closely, as they offer insights into operational efficiency and market positioning.
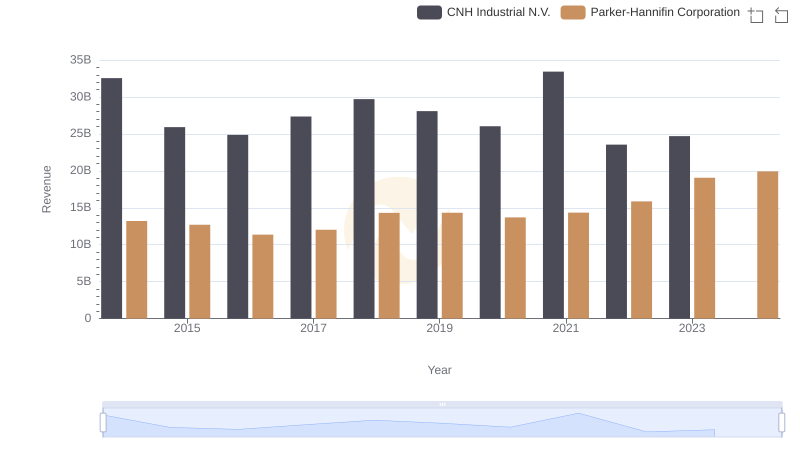
Breaking Down Revenue Trends: Parker-Hannifin Corporation vs CNH Industrial N.V.
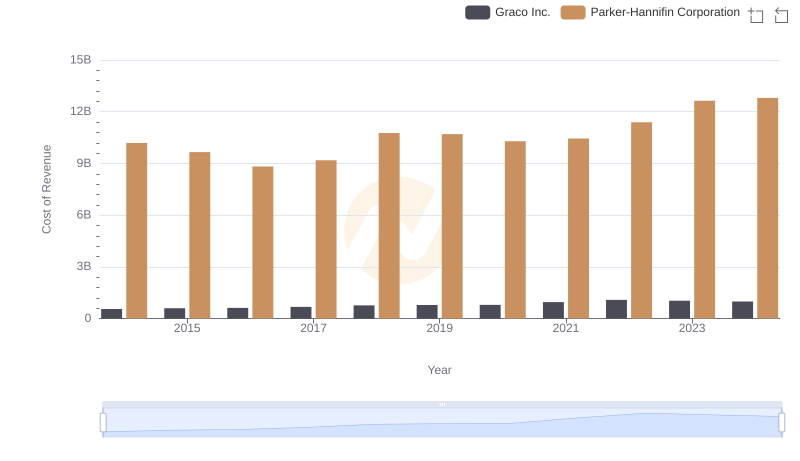
Cost of Revenue: Key Insights for Parker-Hannifin Corporation and Graco Inc.
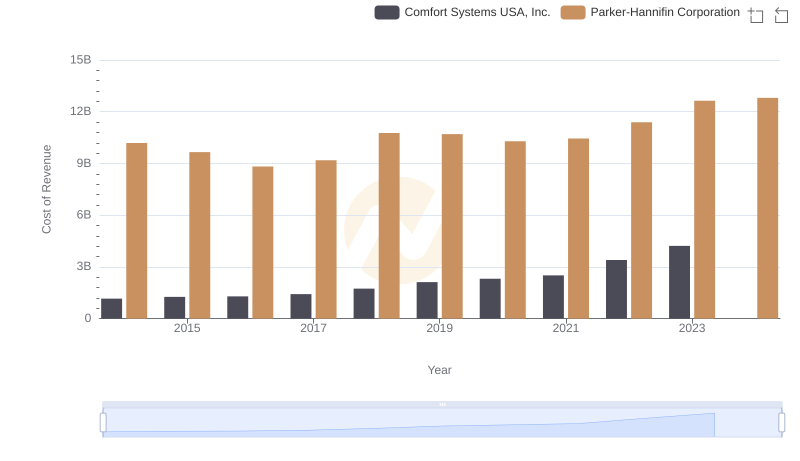
Cost of Revenue Comparison: Parker-Hannifin Corporation vs Comfort Systems USA, Inc.
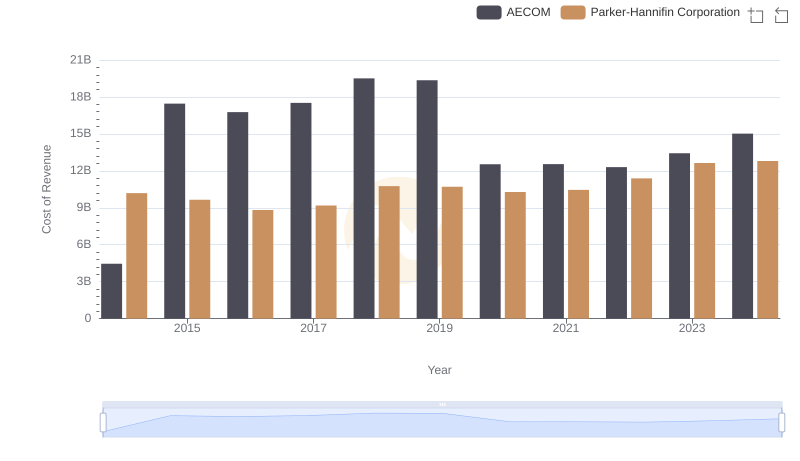
Comparing Cost of Revenue Efficiency: Parker-Hannifin Corporation vs AECOM
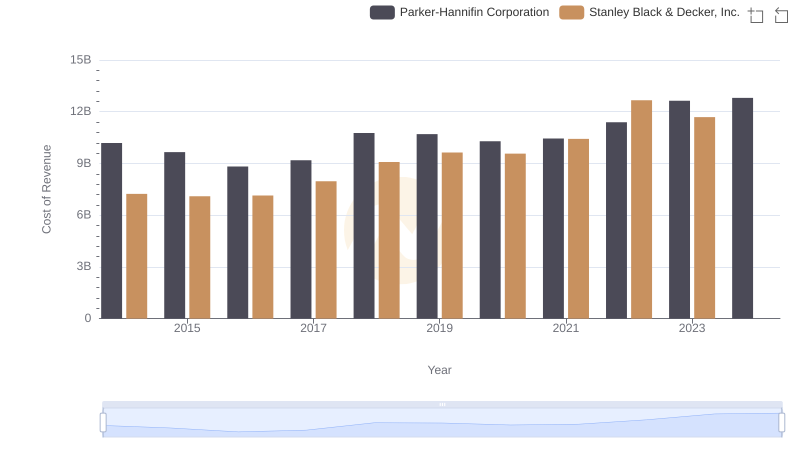
Analyzing Cost of Revenue: Parker-Hannifin Corporation and Stanley Black & Decker, Inc.
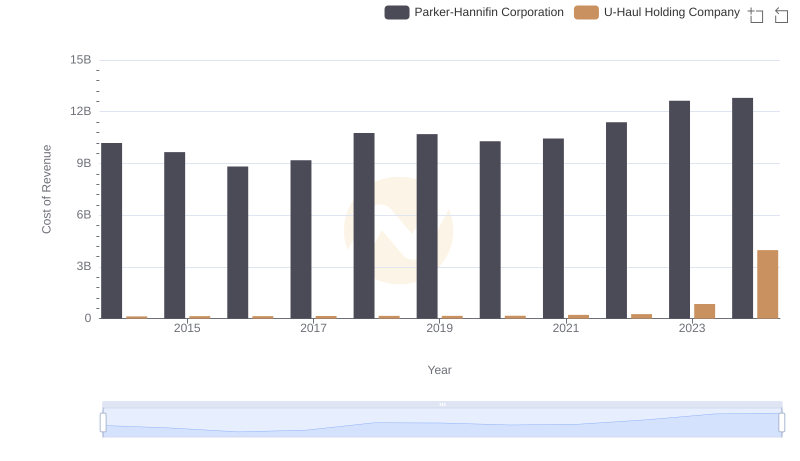
Cost Insights: Breaking Down Parker-Hannifin Corporation and U-Haul Holding Company's Expenses
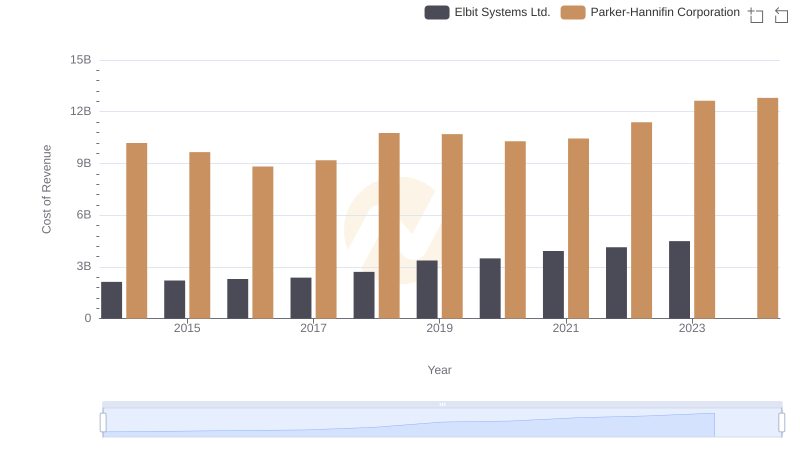
Cost of Revenue Trends: Parker-Hannifin Corporation vs Elbit Systems Ltd.
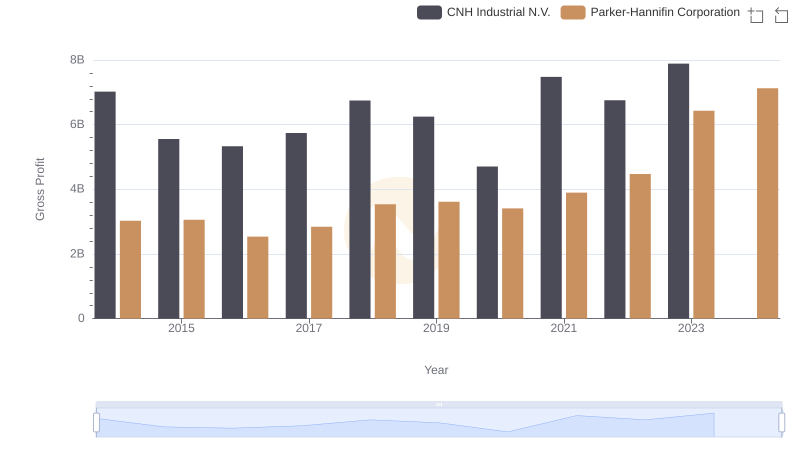
Parker-Hannifin Corporation and CNH Industrial N.V.: A Detailed Gross Profit Analysis
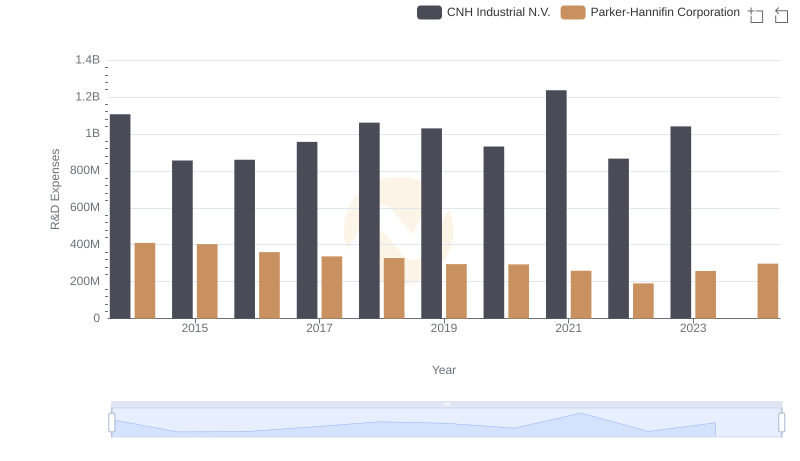
Parker-Hannifin Corporation vs CNH Industrial N.V.: Strategic Focus on R&D Spending
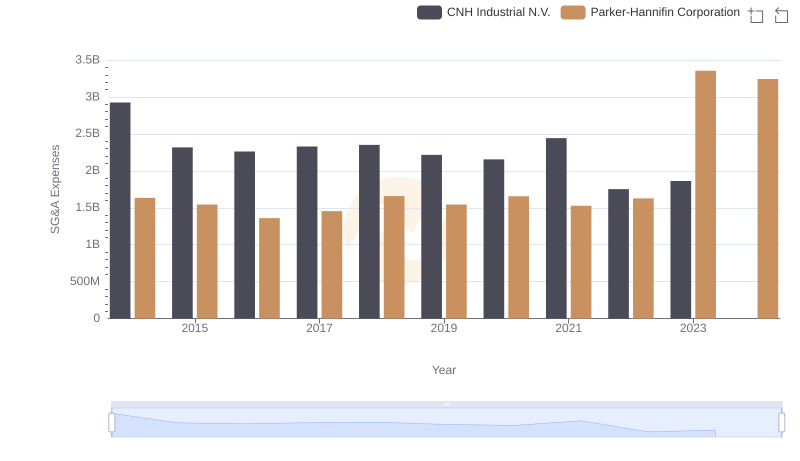
Who Optimizes SG&A Costs Better? Parker-Hannifin Corporation or CNH Industrial N.V.
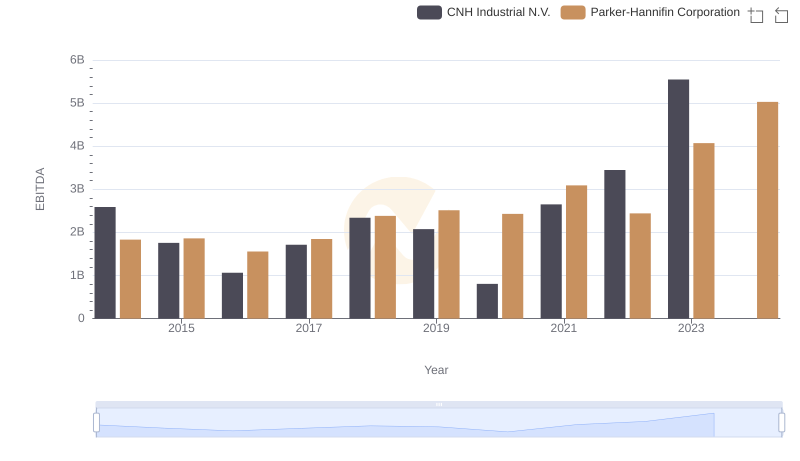
Comprehensive EBITDA Comparison: Parker-Hannifin Corporation vs CNH Industrial N.V.