| __timestamp | AerCap Holdings N.V. | Parker-Hannifin Corporation |
|---|---|---|
| Wednesday, January 1, 2014 | 2997442000 | 1832903000 |
| Thursday, January 1, 2015 | 4313510000 | 1861551000 |
| Friday, January 1, 2016 | 4101801000 | 1558088000 |
| Sunday, January 1, 2017 | 4061381000 | 1846306000 |
| Monday, January 1, 2018 | 2874193000 | 2382235000 |
| Tuesday, January 1, 2019 | 3157061000 | 2513468000 |
| Wednesday, January 1, 2020 | 4028661000 | 2431500000 |
| Friday, January 1, 2021 | 3192341000 | 3092383000 |
| Saturday, January 1, 2022 | 6911148000 | 2441242000 |
| Sunday, January 1, 2023 | 4547656000 | 4071687000 |
| Monday, January 1, 2024 | 5028229000 |
Cracking the code
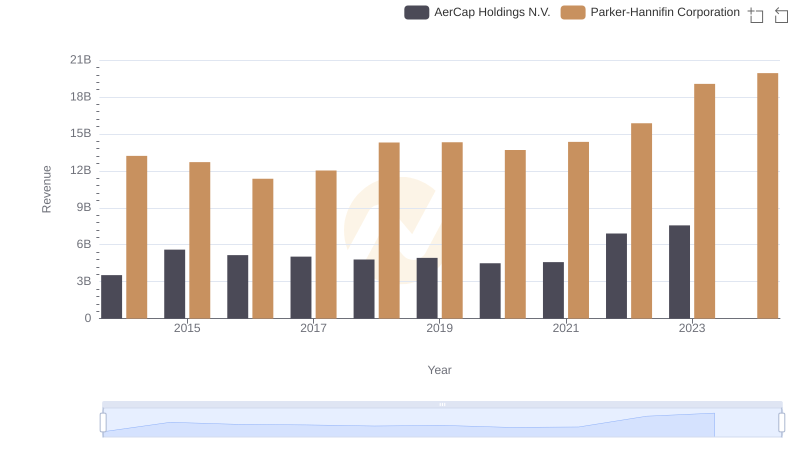
Annual Revenue Comparison: Parker-Hannifin Corporation vs AerCap Holdings N.V.
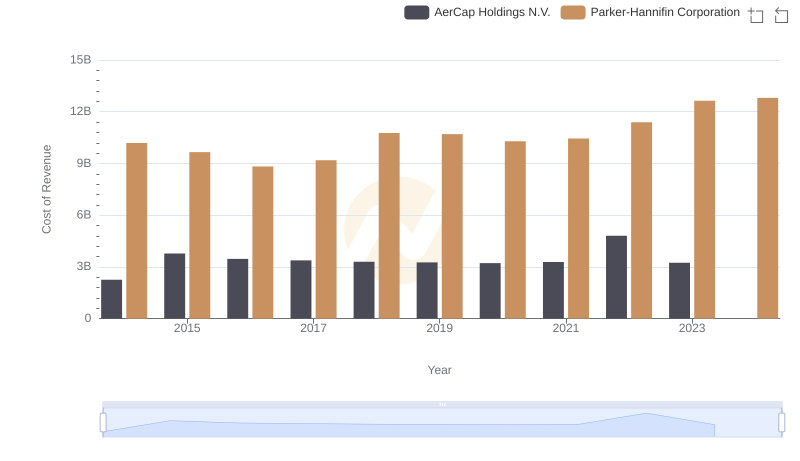
Cost of Revenue Trends: Parker-Hannifin Corporation vs AerCap Holdings N.V.
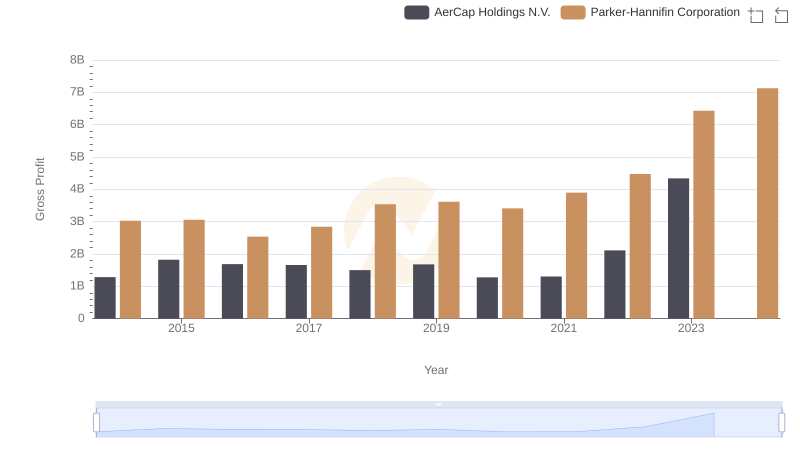
Gross Profit Trends Compared: Parker-Hannifin Corporation vs AerCap Holdings N.V.
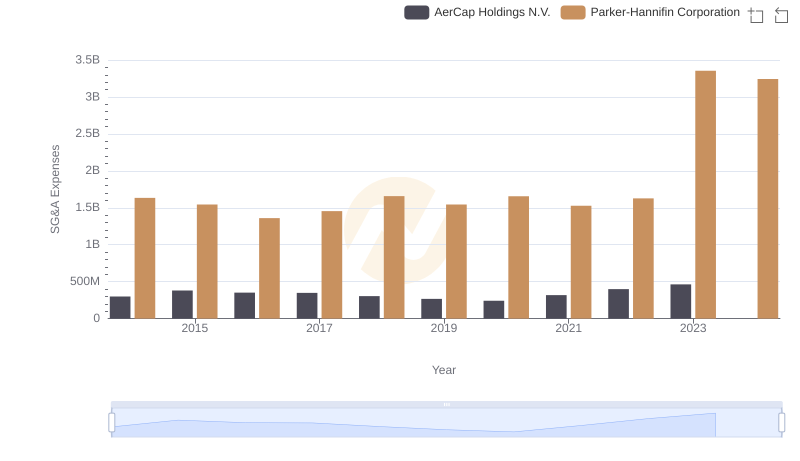
Who Optimizes SG&A Costs Better? Parker-Hannifin Corporation or AerCap Holdings N.V.
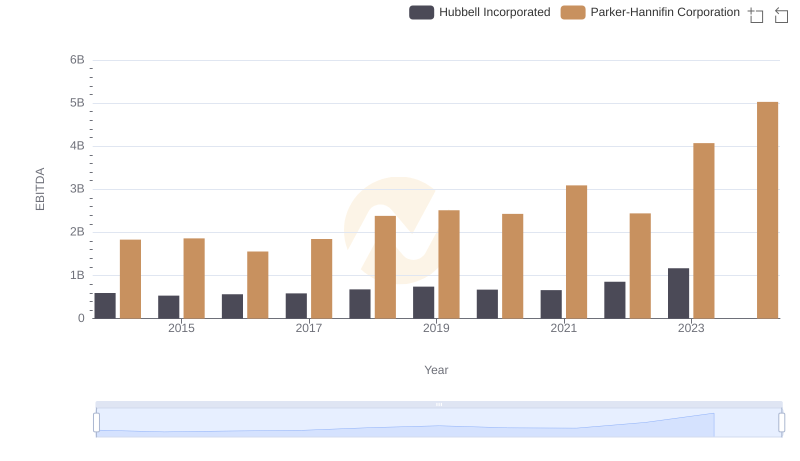
EBITDA Performance Review: Parker-Hannifin Corporation vs Hubbell Incorporated
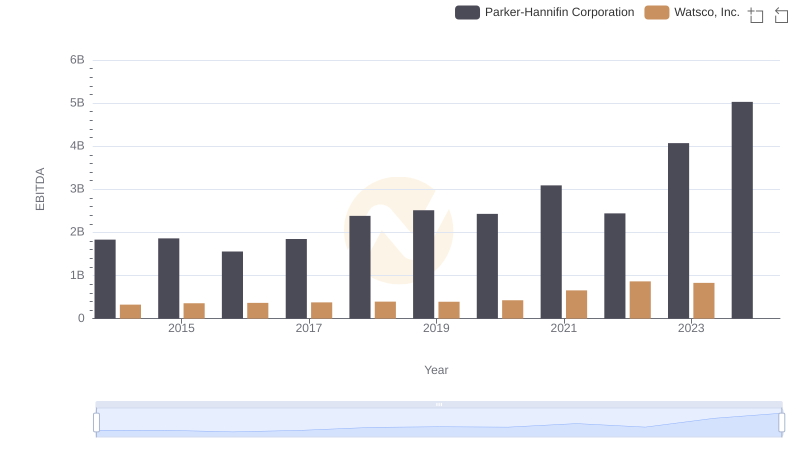
EBITDA Analysis: Evaluating Parker-Hannifin Corporation Against Watsco, Inc.

Comprehensive EBITDA Comparison: Parker-Hannifin Corporation vs EMCOR Group, Inc.
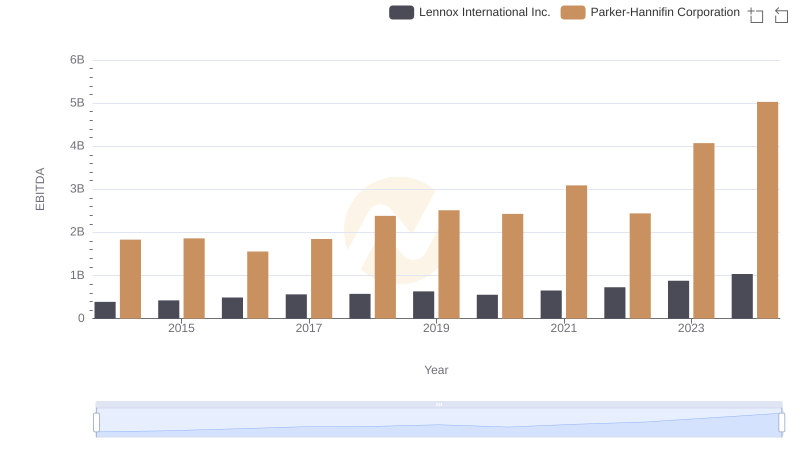
Professional EBITDA Benchmarking: Parker-Hannifin Corporation vs Lennox International Inc.
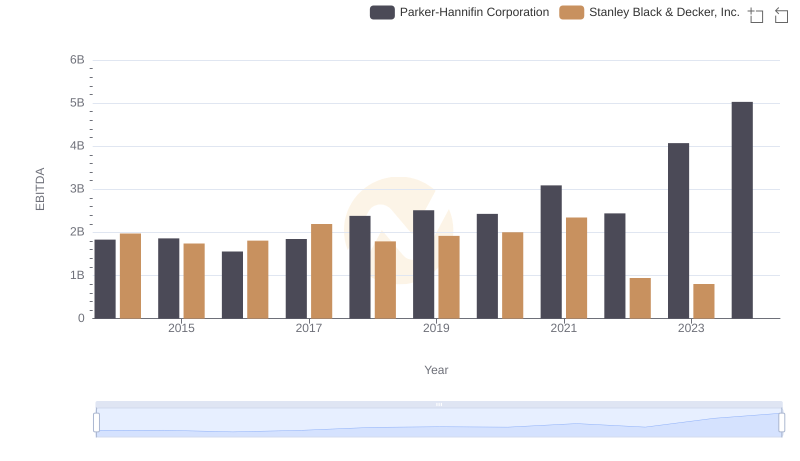
Comparative EBITDA Analysis: Parker-Hannifin Corporation vs Stanley Black & Decker, Inc.
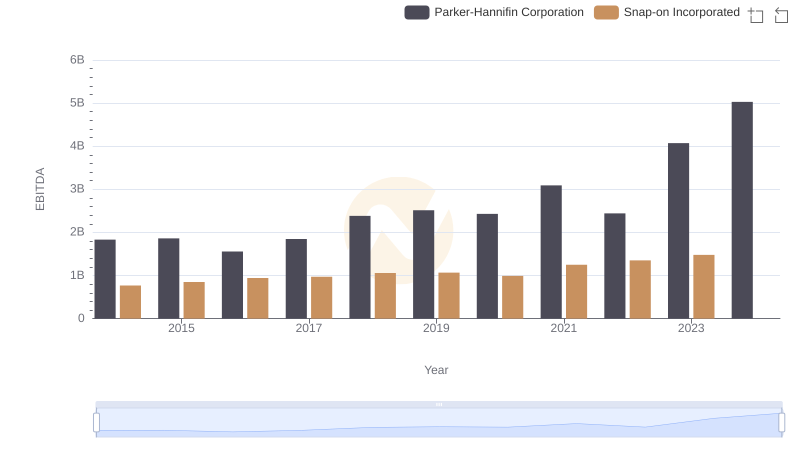
EBITDA Performance Review: Parker-Hannifin Corporation vs Snap-on Incorporated