| __timestamp | Parker-Hannifin Corporation | Snap-on Incorporated |
|---|---|---|
| Wednesday, January 1, 2014 | 1832903000 | 767600000 |
| Thursday, January 1, 2015 | 1861551000 | 848900000 |
| Friday, January 1, 2016 | 1558088000 | 942400000 |
| Sunday, January 1, 2017 | 1846306000 | 971900000 |
| Monday, January 1, 2018 | 2382235000 | 1057400000 |
| Tuesday, January 1, 2019 | 2513468000 | 1067000000 |
| Wednesday, January 1, 2020 | 2431500000 | 991400000 |
| Friday, January 1, 2021 | 3092383000 | 1249100000 |
| Saturday, January 1, 2022 | 2441242000 | 1351500000 |
| Sunday, January 1, 2023 | 4071687000 | 1478800000 |
| Monday, January 1, 2024 | 5028229000 | 1520700000 |
Infusing magic into the data realm
In the ever-evolving landscape of industrial giants, Parker-Hannifin Corporation and Snap-on Incorporated have showcased intriguing EBITDA trends over the past decade. From 2014 to 2023, Parker-Hannifin's EBITDA surged by an impressive 175%, peaking in 2023. This growth reflects the company's strategic innovations and market adaptability. In contrast, Snap-on's EBITDA grew by approximately 93% during the same period, highlighting its steady yet less aggressive expansion.
These trends offer a window into the strategic maneuvers of these industrial leaders, providing valuable insights for investors and industry enthusiasts alike.
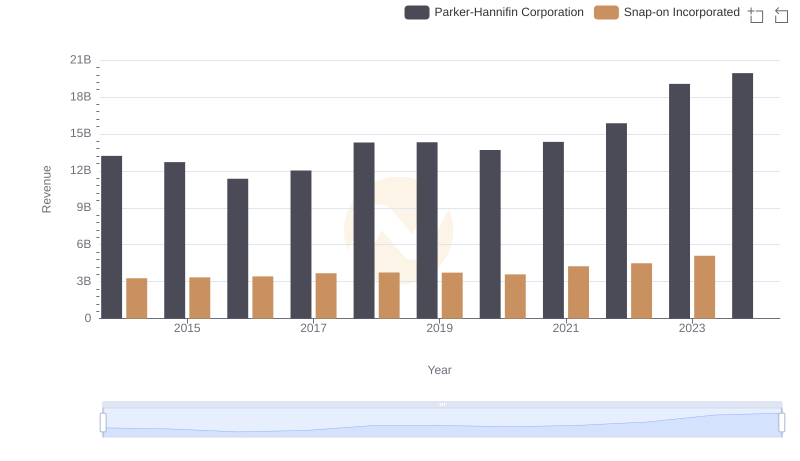
Revenue Showdown: Parker-Hannifin Corporation vs Snap-on Incorporated
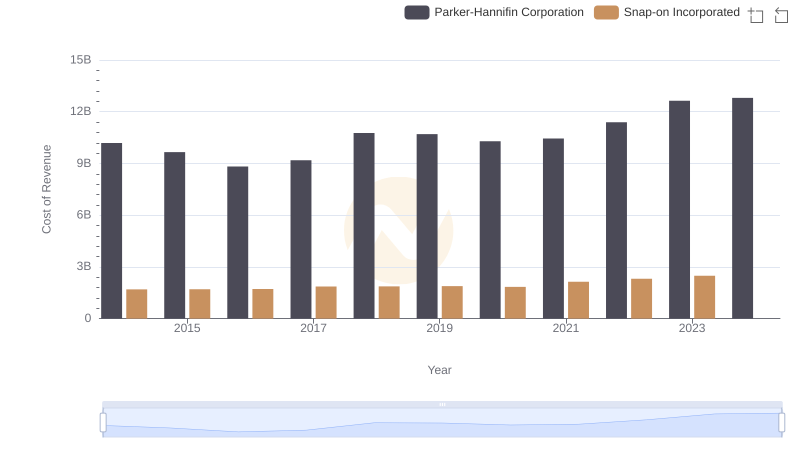
Analyzing Cost of Revenue: Parker-Hannifin Corporation and Snap-on Incorporated
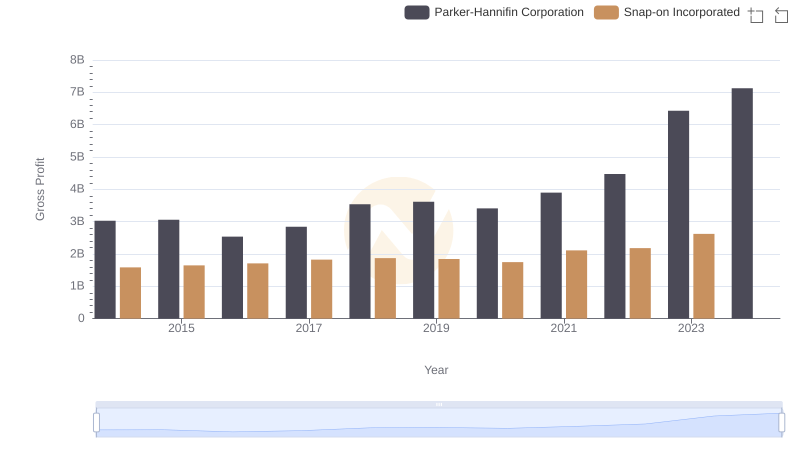
Gross Profit Trends Compared: Parker-Hannifin Corporation vs Snap-on Incorporated
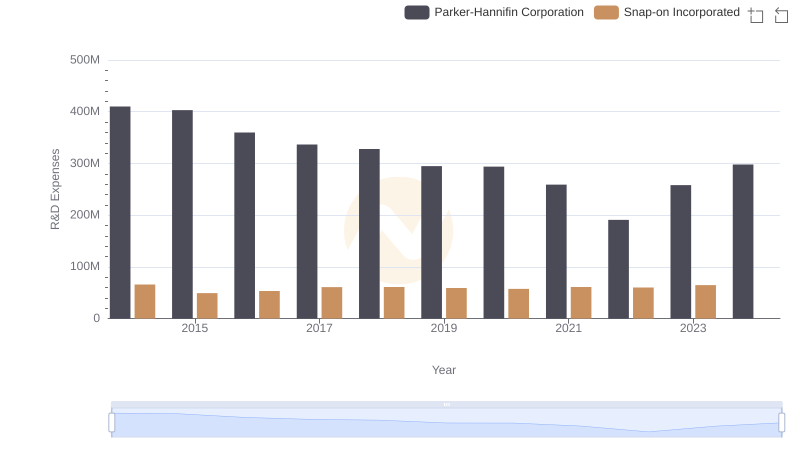
Research and Development Expenses Breakdown: Parker-Hannifin Corporation vs Snap-on Incorporated
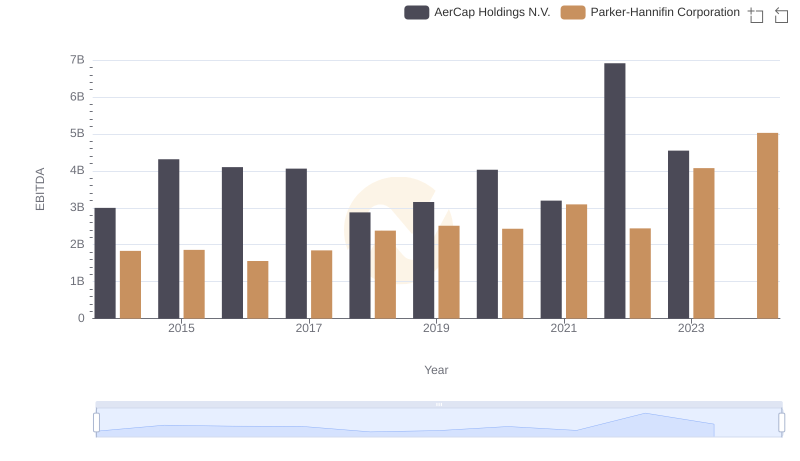
Parker-Hannifin Corporation and AerCap Holdings N.V.: A Detailed Examination of EBITDA Performance
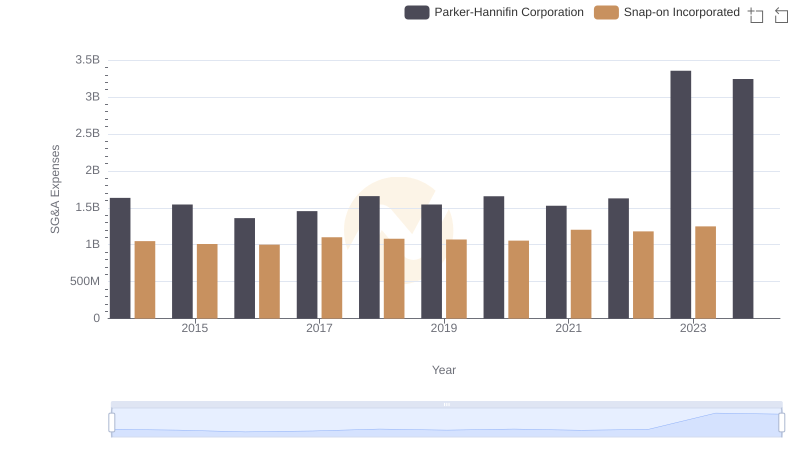
SG&A Efficiency Analysis: Comparing Parker-Hannifin Corporation and Snap-on Incorporated
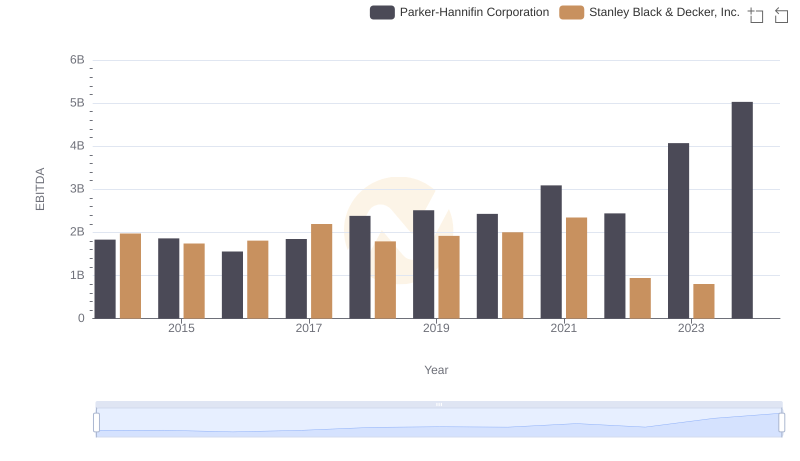
Comparative EBITDA Analysis: Parker-Hannifin Corporation vs Stanley Black & Decker, Inc.
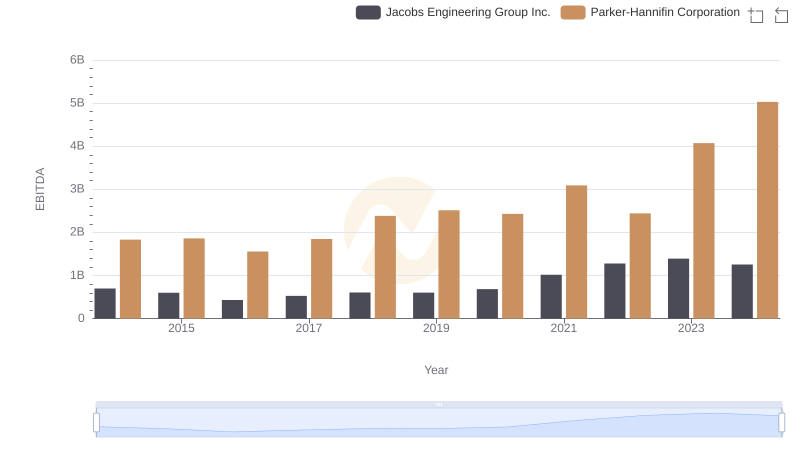
EBITDA Metrics Evaluated: Parker-Hannifin Corporation vs Jacobs Engineering Group Inc.
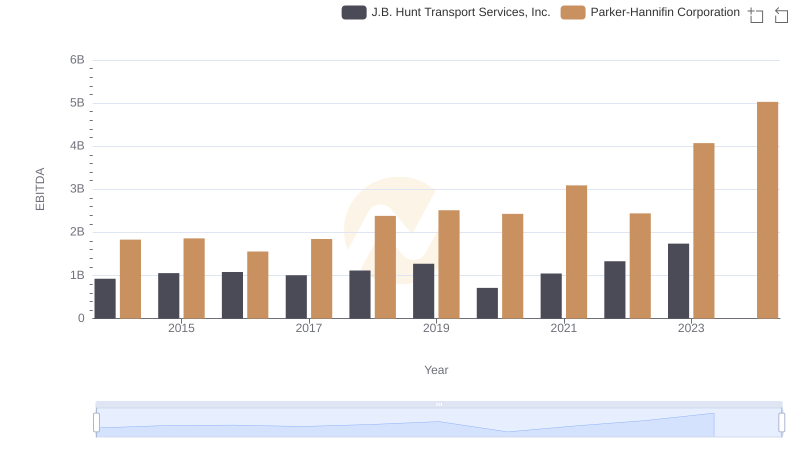
Comprehensive EBITDA Comparison: Parker-Hannifin Corporation vs J.B. Hunt Transport Services, Inc.
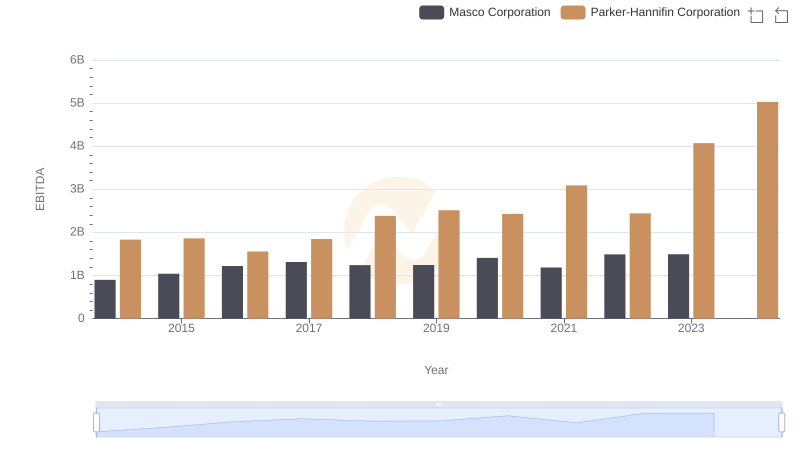
Professional EBITDA Benchmarking: Parker-Hannifin Corporation vs Masco Corporation
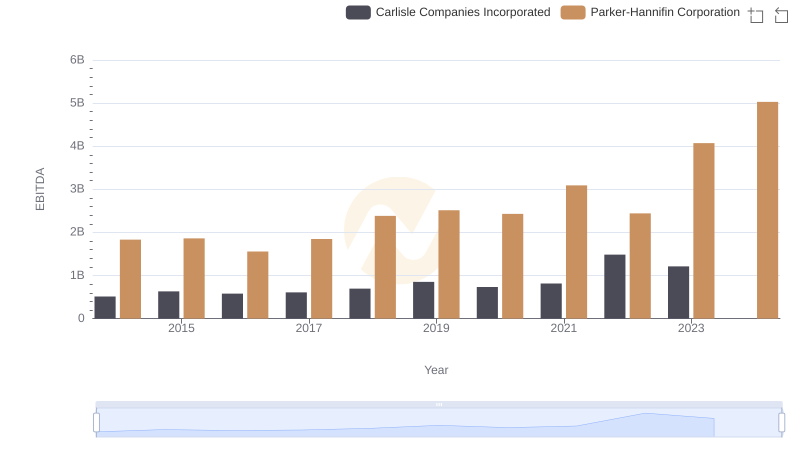
EBITDA Analysis: Evaluating Parker-Hannifin Corporation Against Carlisle Companies Incorporated