| __timestamp | Parker-Hannifin Corporation | Watsco, Inc. |
|---|---|---|
| Wednesday, January 1, 2014 | 1832903000 | 323674000 |
| Thursday, January 1, 2015 | 1861551000 | 355865000 |
| Friday, January 1, 2016 | 1558088000 | 365698000 |
| Sunday, January 1, 2017 | 1846306000 | 375907000 |
| Monday, January 1, 2018 | 2382235000 | 394177000 |
| Tuesday, January 1, 2019 | 2513468000 | 391396000 |
| Wednesday, January 1, 2020 | 2431500000 | 426942000 |
| Friday, January 1, 2021 | 3092383000 | 656655000 |
| Saturday, January 1, 2022 | 2441242000 | 863261000 |
| Sunday, January 1, 2023 | 4071687000 | 829900000 |
| Monday, January 1, 2024 | 5028229000 | 781775000 |
Igniting the spark of knowledge
In the ever-evolving landscape of industrial and HVAC sectors, Parker-Hannifin Corporation and Watsco, Inc. have emerged as key players. Over the past decade, Parker-Hannifin has demonstrated a robust growth trajectory in EBITDA, with a remarkable increase of approximately 175% from 2014 to 2023. This growth underscores its strategic initiatives and market adaptability. In contrast, Watsco, Inc. has shown a steady yet modest growth of around 156% over the same period, reflecting its consistent performance in the HVAC distribution market.
The year 2023 marked a significant milestone for Parker-Hannifin, achieving an EBITDA of over $4 billion, a testament to its operational efficiency and market expansion strategies. Meanwhile, Watsco's EBITDA peaked in 2022, highlighting potential challenges or strategic shifts in 2023. This analysis provides a comprehensive view of how these industry giants have navigated economic fluctuations and market demands.
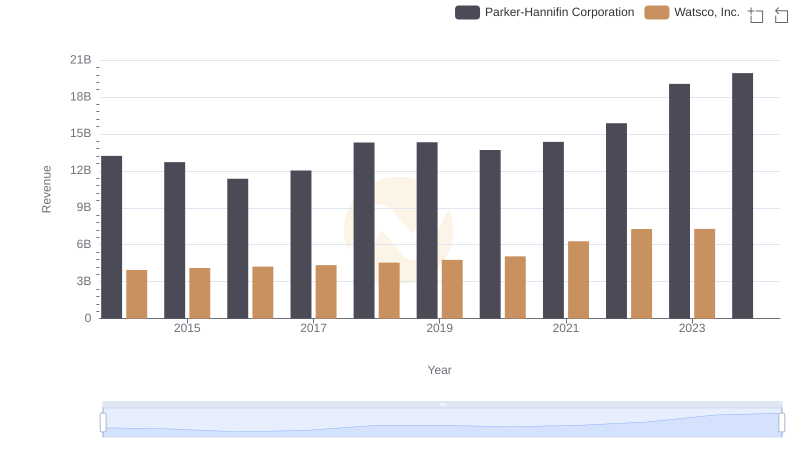
Who Generates More Revenue? Parker-Hannifin Corporation or Watsco, Inc.
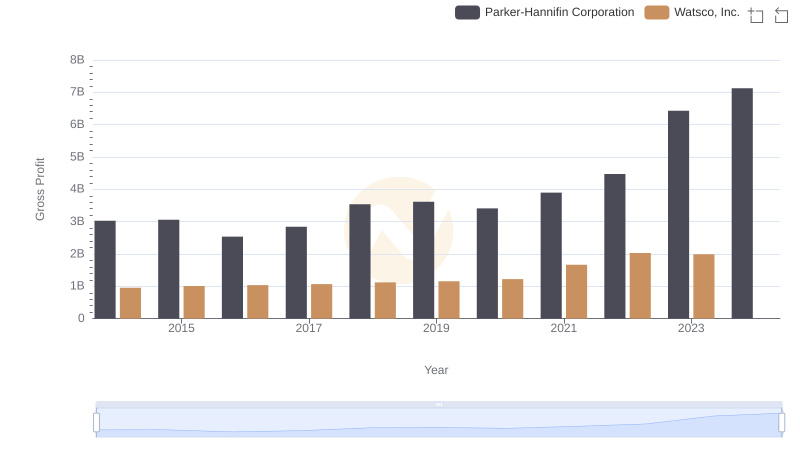
Gross Profit Comparison: Parker-Hannifin Corporation and Watsco, Inc. Trends
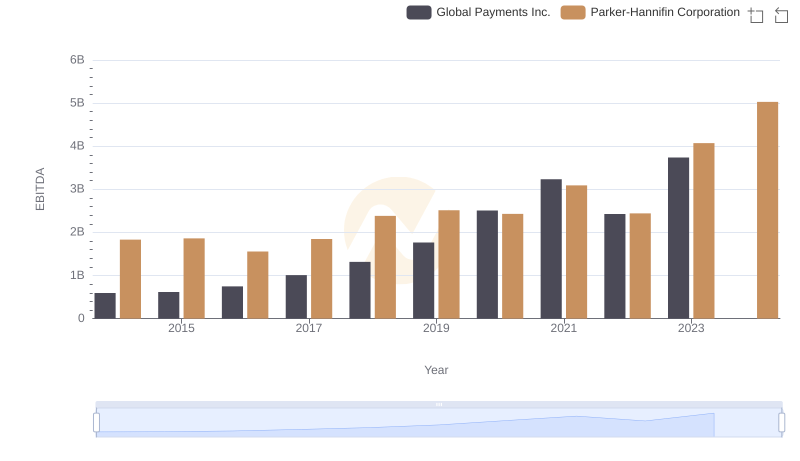
EBITDA Performance Review: Parker-Hannifin Corporation vs Global Payments Inc.
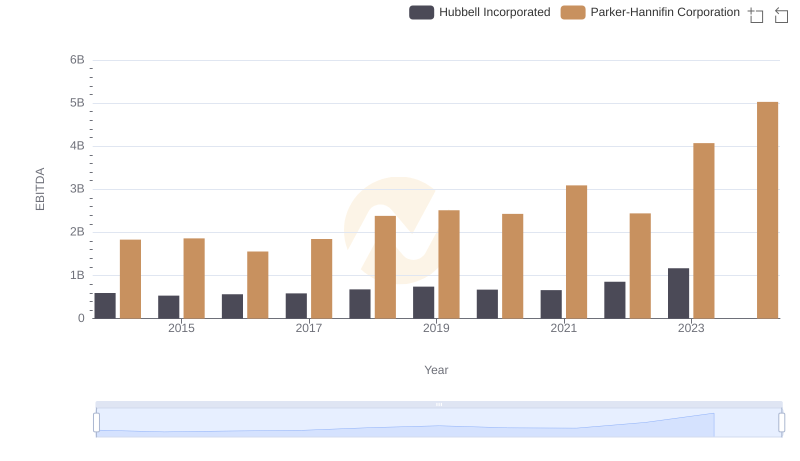
EBITDA Performance Review: Parker-Hannifin Corporation vs Hubbell Incorporated

Comprehensive EBITDA Comparison: Parker-Hannifin Corporation vs EMCOR Group, Inc.
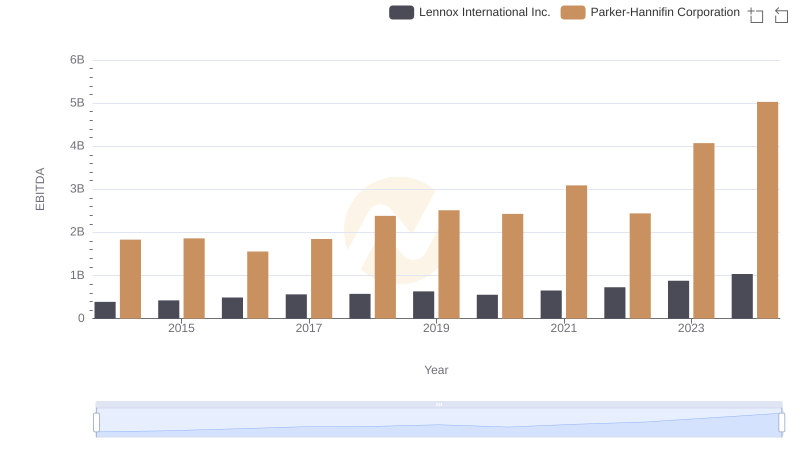
Professional EBITDA Benchmarking: Parker-Hannifin Corporation vs Lennox International Inc.
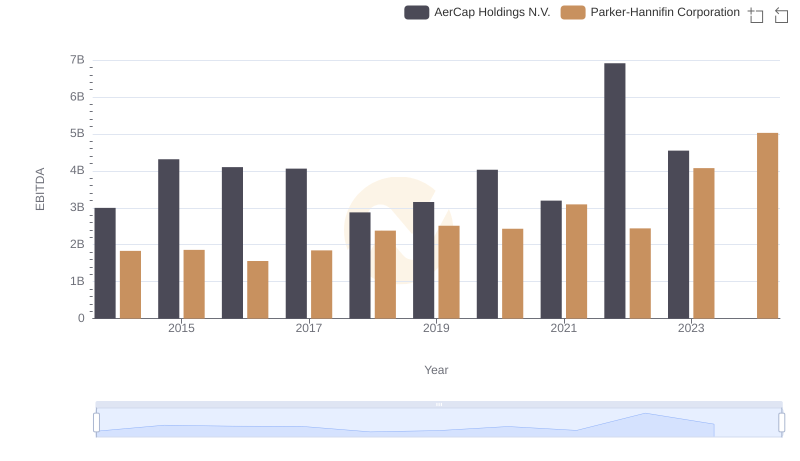
Parker-Hannifin Corporation and AerCap Holdings N.V.: A Detailed Examination of EBITDA Performance