| __timestamp | EMCOR Group, Inc. | Parker-Hannifin Corporation |
|---|---|---|
| Wednesday, January 1, 2014 | 355858000 | 1832903000 |
| Thursday, January 1, 2015 | 362095000 | 1861551000 |
| Friday, January 1, 2016 | 395913000 | 1558088000 |
| Sunday, January 1, 2017 | 478459000 | 1846306000 |
| Monday, January 1, 2018 | 489954000 | 2382235000 |
| Tuesday, January 1, 2019 | 556055000 | 2513468000 |
| Wednesday, January 1, 2020 | 601449000 | 2431500000 |
| Friday, January 1, 2021 | 646861000 | 3092383000 |
| Saturday, January 1, 2022 | 682399000 | 2441242000 |
| Sunday, January 1, 2023 | 1009017000 | 4071687000 |
| Monday, January 1, 2024 | 5028229000 |
Cracking the code
In the ever-evolving landscape of industrial giants, Parker-Hannifin Corporation and EMCOR Group, Inc. have showcased remarkable financial trajectories over the past decade. From 2014 to 2023, Parker-Hannifin's EBITDA surged by an impressive 122%, reflecting its robust operational strategies and market adaptability. In contrast, EMCOR Group experienced a 184% increase, underscoring its resilience and growth in the competitive engineering and construction sectors.
This comparison highlights the dynamic growth patterns and strategic prowess of these industry leaders.
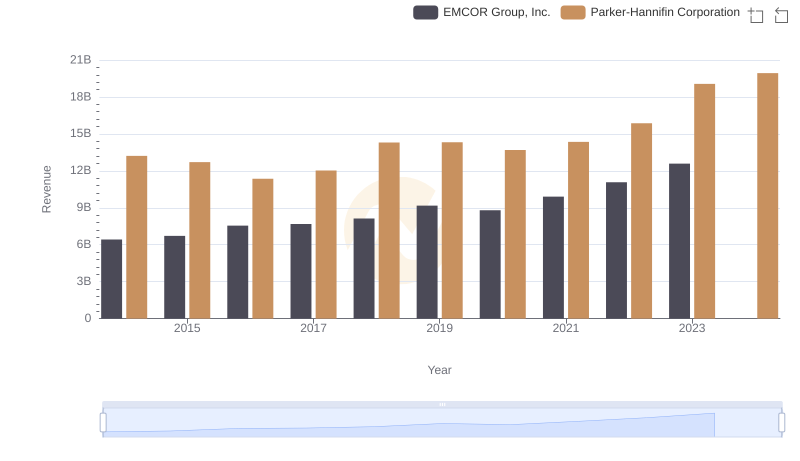
Who Generates More Revenue? Parker-Hannifin Corporation or EMCOR Group, Inc.
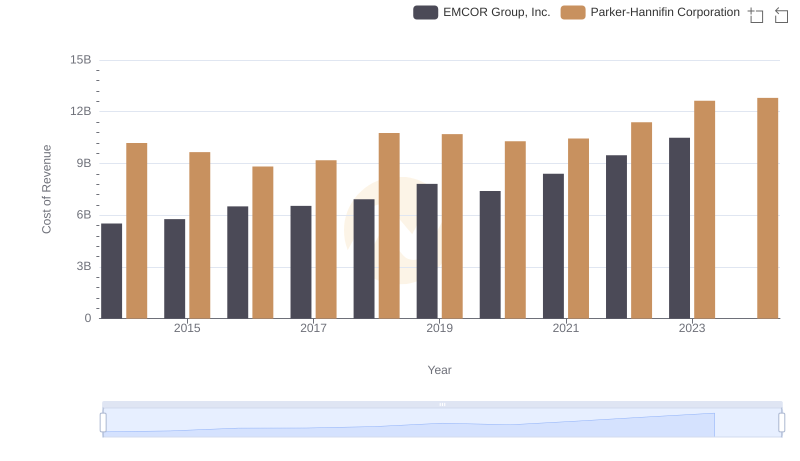
Cost Insights: Breaking Down Parker-Hannifin Corporation and EMCOR Group, Inc.'s Expenses
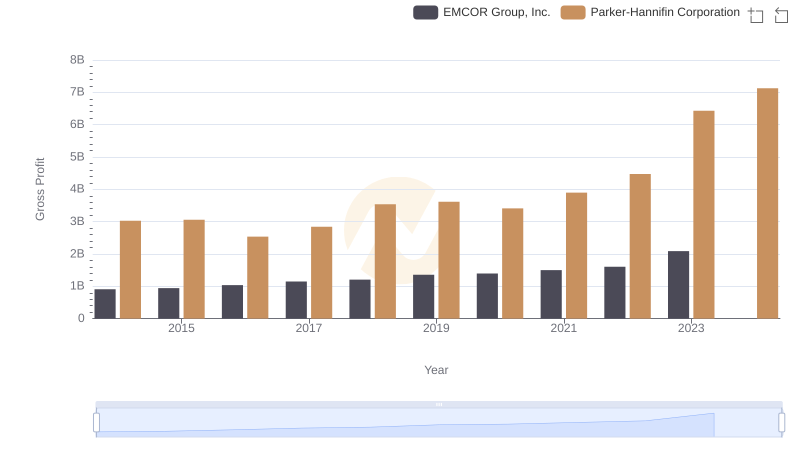
Who Generates Higher Gross Profit? Parker-Hannifin Corporation or EMCOR Group, Inc.
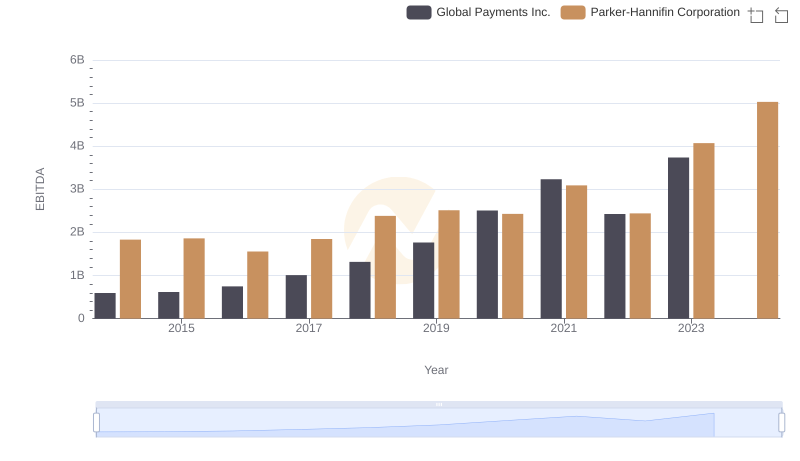
EBITDA Performance Review: Parker-Hannifin Corporation vs Global Payments Inc.
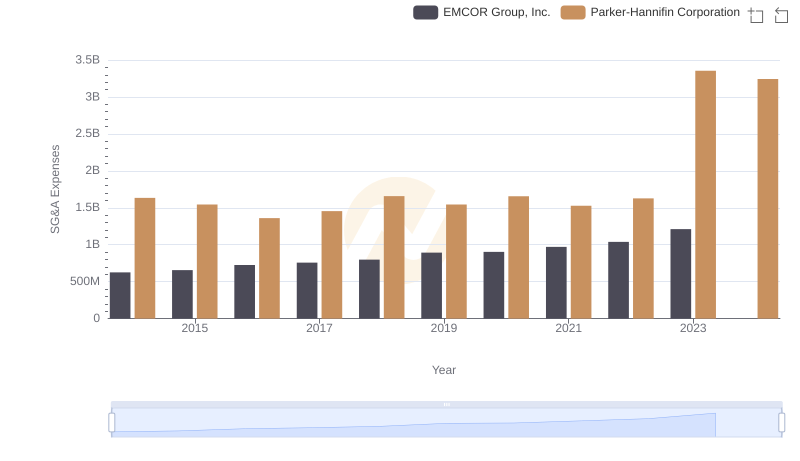
Who Optimizes SG&A Costs Better? Parker-Hannifin Corporation or EMCOR Group, Inc.
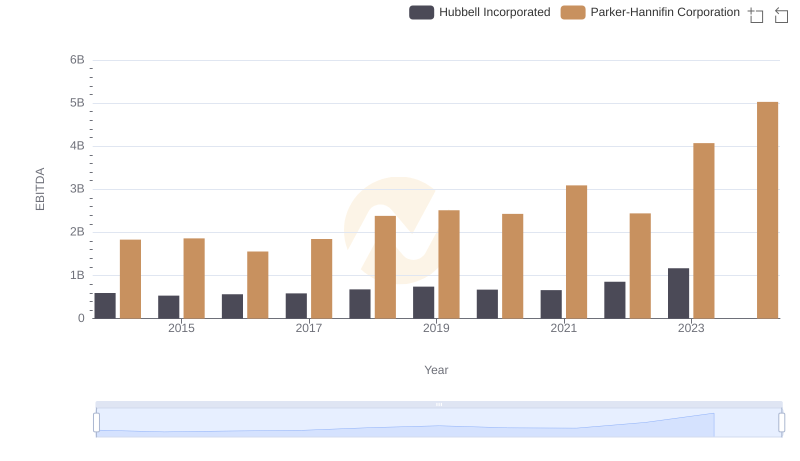
EBITDA Performance Review: Parker-Hannifin Corporation vs Hubbell Incorporated
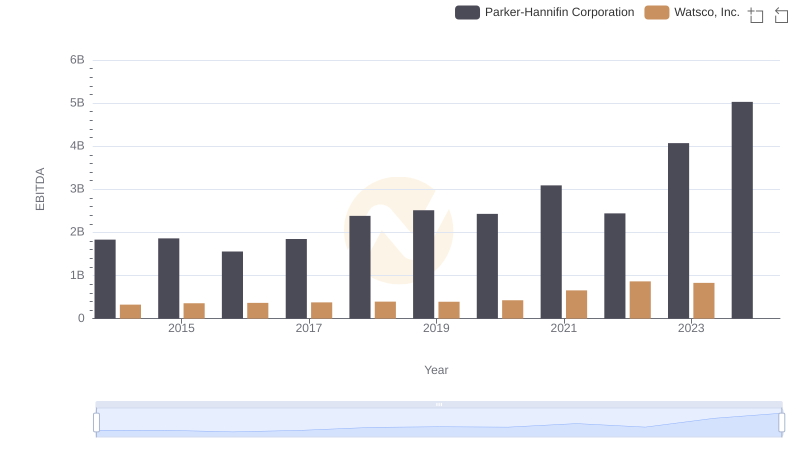
EBITDA Analysis: Evaluating Parker-Hannifin Corporation Against Watsco, Inc.
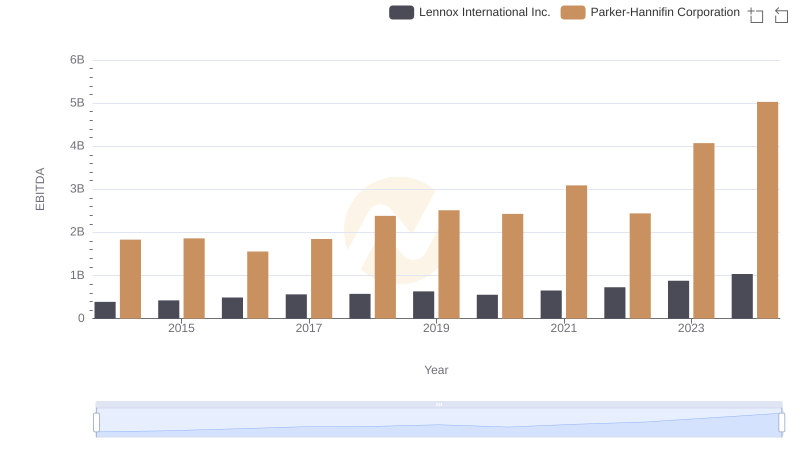
Professional EBITDA Benchmarking: Parker-Hannifin Corporation vs Lennox International Inc.
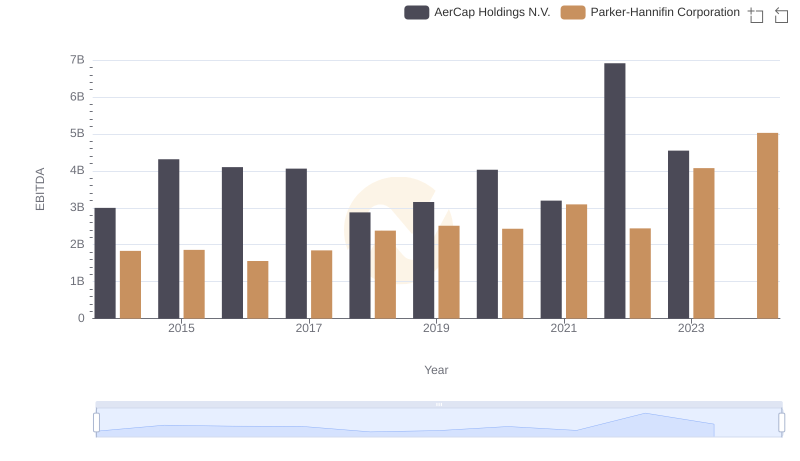
Parker-Hannifin Corporation and AerCap Holdings N.V.: A Detailed Examination of EBITDA Performance