| __timestamp | AerCap Holdings N.V. | Parker-Hannifin Corporation |
|---|---|---|
| Wednesday, January 1, 2014 | 1282919000 | 3027744000 |
| Thursday, January 1, 2015 | 1822255000 | 3056499000 |
| Friday, January 1, 2016 | 1686404000 | 2537369000 |
| Sunday, January 1, 2017 | 1660054000 | 2840350000 |
| Monday, January 1, 2018 | 1500345000 | 3539551000 |
| Tuesday, January 1, 2019 | 1678249000 | 3616840000 |
| Wednesday, January 1, 2020 | 1276496000 | 3409002000 |
| Friday, January 1, 2021 | 1301517000 | 3897960000 |
| Saturday, January 1, 2022 | 2109708000 | 4474341000 |
| Sunday, January 1, 2023 | 4337648000 | 6429302000 |
| Monday, January 1, 2024 | 7127790000 |
In pursuit of knowledge
In the competitive landscape of industrial and financial sectors, Parker-Hannifin Corporation and AerCap Holdings N.V. have showcased intriguing gross profit trends over the past decade. From 2014 to 2023, Parker-Hannifin consistently outperformed AerCap, with a notable 112% increase in gross profit, peaking at approximately $6.4 billion in 2023. In contrast, AerCap's gross profit saw a significant surge in 2023, reaching around $4.3 billion, marking a 238% increase from its 2014 figures. This dramatic rise highlights AerCap's strategic maneuvers in the aviation leasing market. However, data for 2024 is missing for AerCap, leaving room for speculation on its future trajectory. These trends underscore the dynamic nature of these industries and the strategic decisions that drive financial performance.
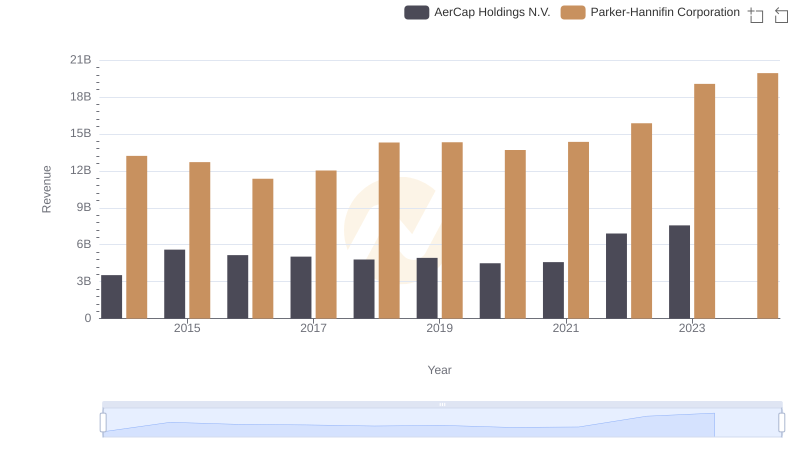
Annual Revenue Comparison: Parker-Hannifin Corporation vs AerCap Holdings N.V.
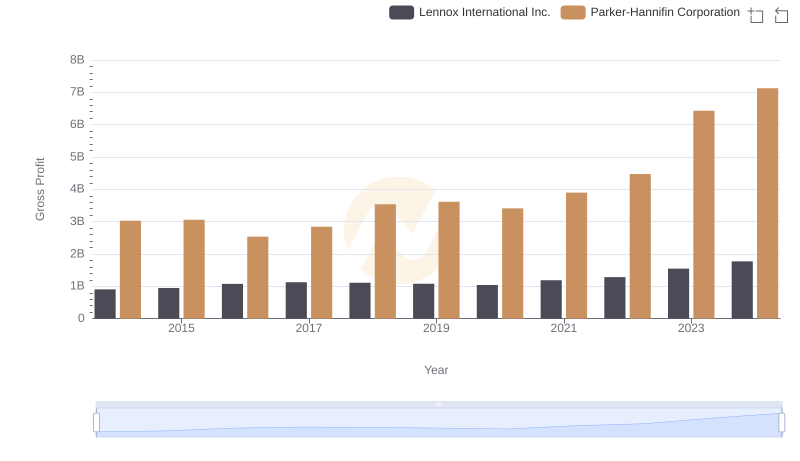
Gross Profit Comparison: Parker-Hannifin Corporation and Lennox International Inc. Trends
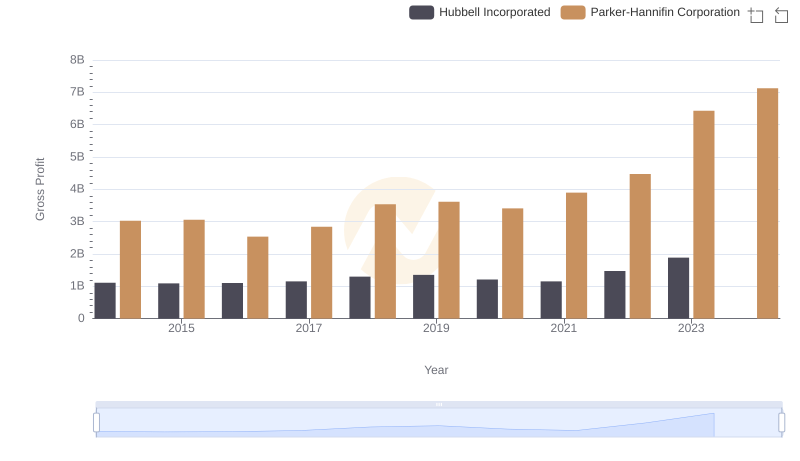
Gross Profit Comparison: Parker-Hannifin Corporation and Hubbell Incorporated Trends
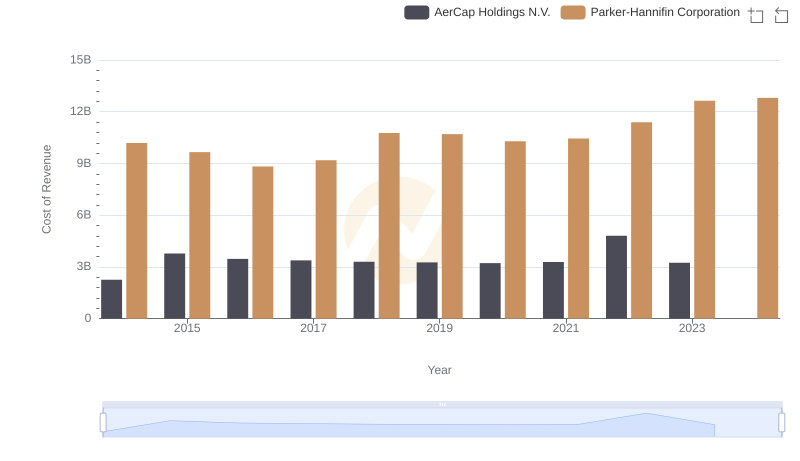
Cost of Revenue Trends: Parker-Hannifin Corporation vs AerCap Holdings N.V.
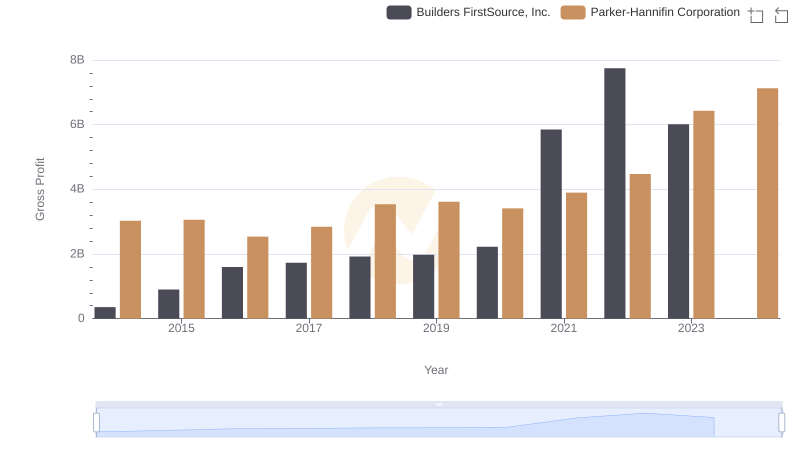
Parker-Hannifin Corporation and Builders FirstSource, Inc.: A Detailed Gross Profit Analysis
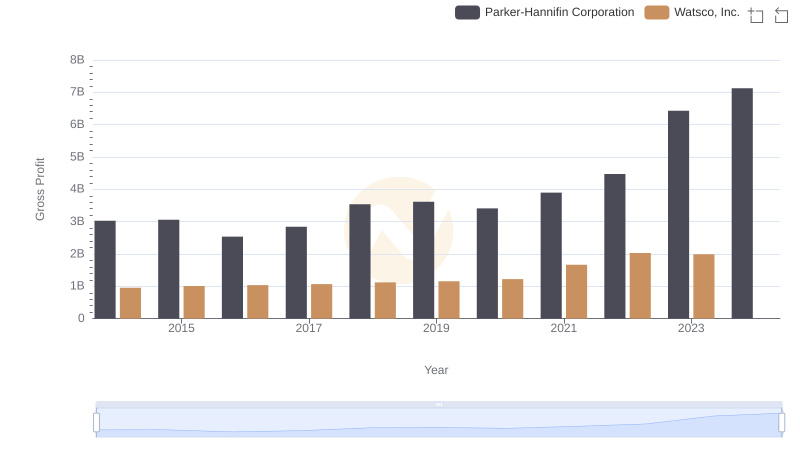
Gross Profit Comparison: Parker-Hannifin Corporation and Watsco, Inc. Trends
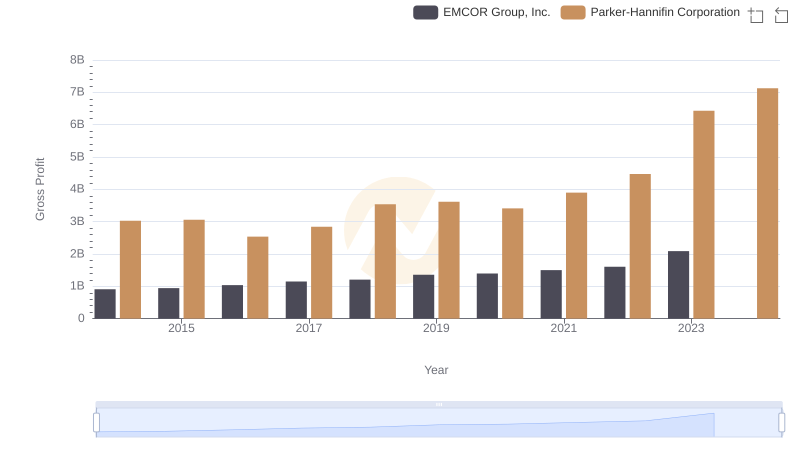
Who Generates Higher Gross Profit? Parker-Hannifin Corporation or EMCOR Group, Inc.
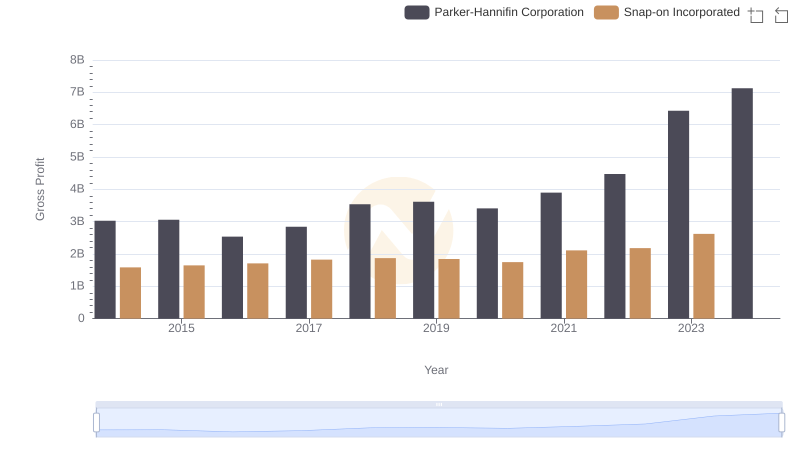
Gross Profit Trends Compared: Parker-Hannifin Corporation vs Snap-on Incorporated
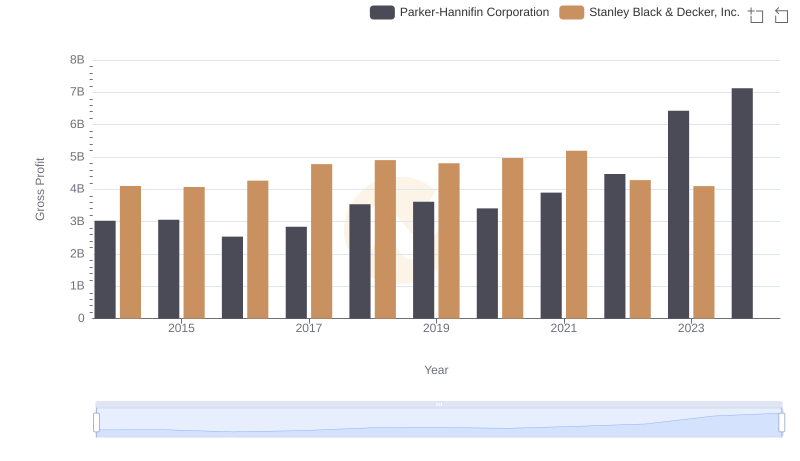
Parker-Hannifin Corporation and Stanley Black & Decker, Inc.: A Detailed Gross Profit Analysis
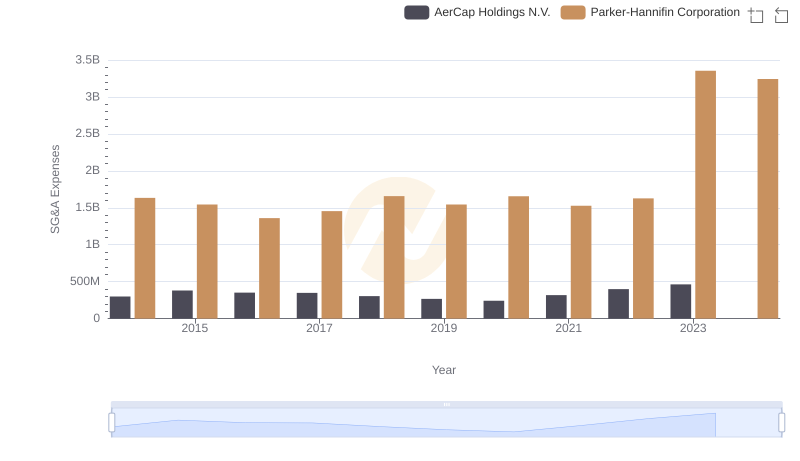
Who Optimizes SG&A Costs Better? Parker-Hannifin Corporation or AerCap Holdings N.V.
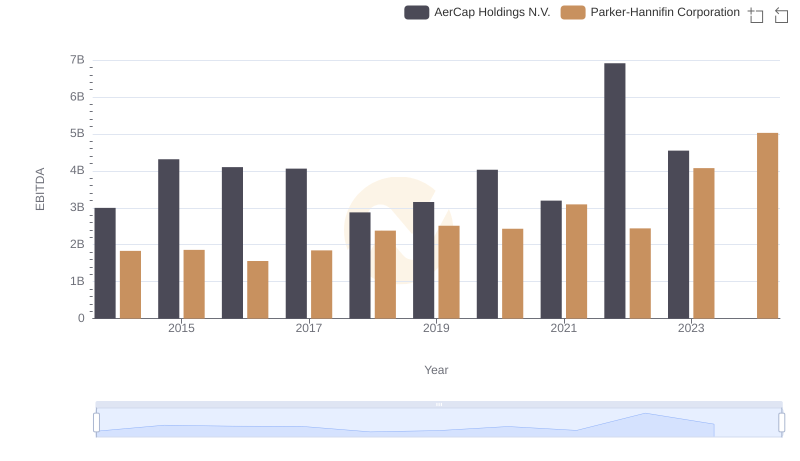
Parker-Hannifin Corporation and AerCap Holdings N.V.: A Detailed Examination of EBITDA Performance