| __timestamp | AerCap Holdings N.V. | Parker-Hannifin Corporation |
|---|---|---|
| Wednesday, January 1, 2014 | 2252878000 | 10188227000 |
| Thursday, January 1, 2015 | 3776407000 | 9655245000 |
| Friday, January 1, 2016 | 3465727000 | 8823384000 |
| Sunday, January 1, 2017 | 3377439000 | 9188962000 |
| Monday, January 1, 2018 | 3299635000 | 10762841000 |
| Tuesday, January 1, 2019 | 3259091000 | 10703484000 |
| Wednesday, January 1, 2020 | 3217133000 | 10286518000 |
| Friday, January 1, 2021 | 3287413000 | 10449680000 |
| Saturday, January 1, 2022 | 4805277000 | 11387267000 |
| Sunday, January 1, 2023 | 3237016000 | 12635892000 |
| Monday, January 1, 2024 | 12801816000 |
Unlocking the unknown
In the ever-evolving landscape of industrial and aviation sectors, understanding cost dynamics is crucial. Parker-Hannifin Corporation, a leader in motion and control technologies, has shown a steady increase in its cost of revenue over the past decade. From 2014 to 2023, Parker-Hannifin's cost of revenue rose by approximately 24%, peaking at $12.6 billion in 2023. This upward trend reflects the company's expansion and increased operational scale.
Conversely, AerCap Holdings N.V., a prominent player in aircraft leasing, experienced more volatility. While its cost of revenue surged by 113% from 2014 to 2022, reaching a high of $4.8 billion, it saw a decline in 2023. This fluctuation may indicate strategic shifts or market challenges.
The data for 2024 is incomplete, highlighting the need for continuous monitoring to capture emerging trends. These insights are vital for stakeholders aiming to navigate the complexities of these industries.
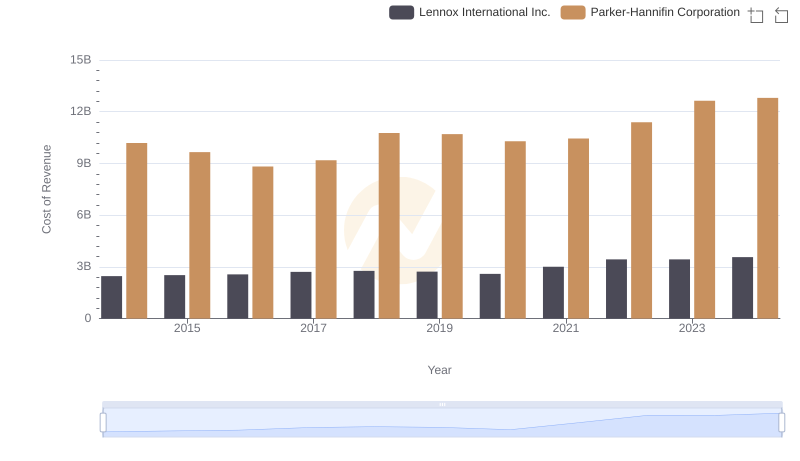
Analyzing Cost of Revenue: Parker-Hannifin Corporation and Lennox International Inc.
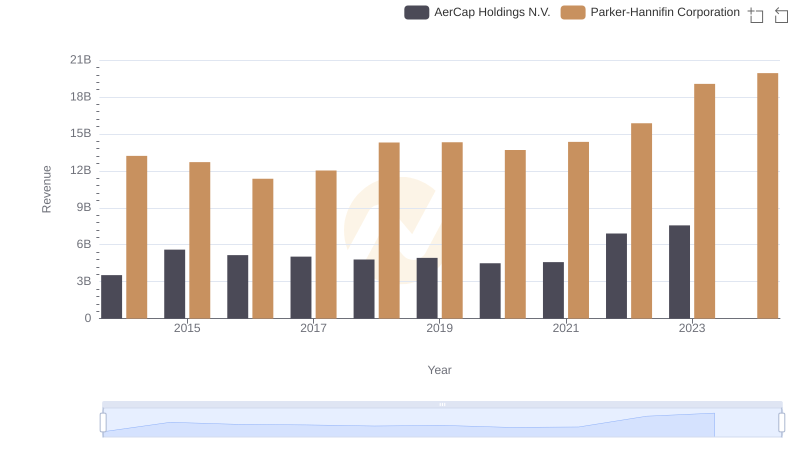
Annual Revenue Comparison: Parker-Hannifin Corporation vs AerCap Holdings N.V.

Analyzing Cost of Revenue: Parker-Hannifin Corporation and Builders FirstSource, Inc.
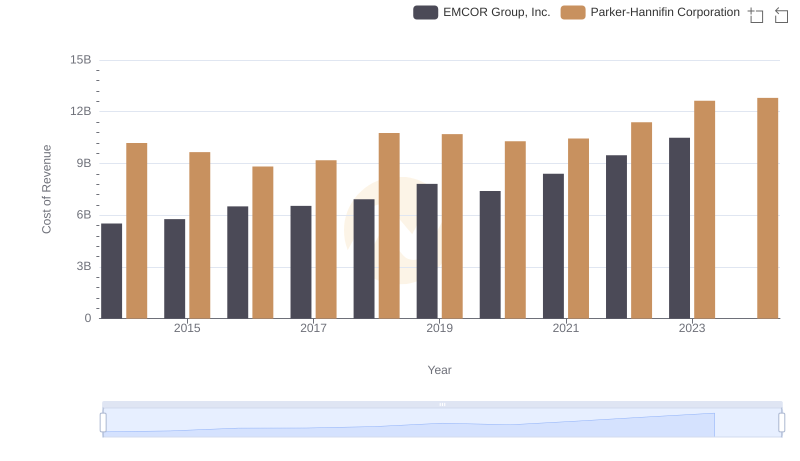
Cost Insights: Breaking Down Parker-Hannifin Corporation and EMCOR Group, Inc.'s Expenses
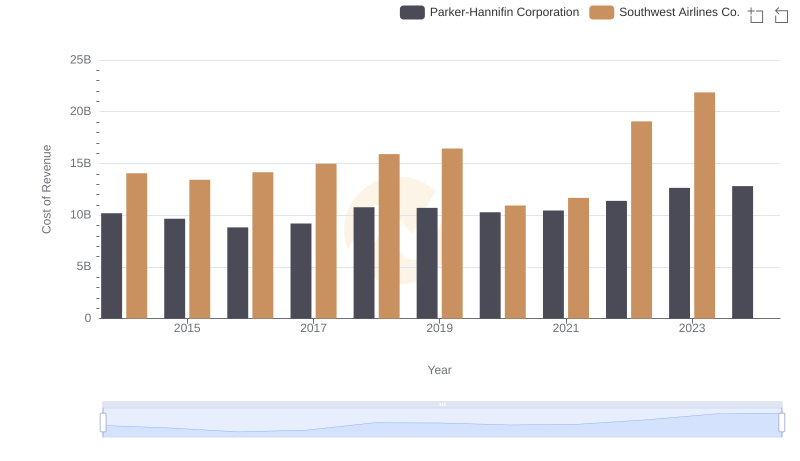
Comparing Cost of Revenue Efficiency: Parker-Hannifin Corporation vs Southwest Airlines Co.

Cost of Revenue Comparison: Parker-Hannifin Corporation vs TransUnion
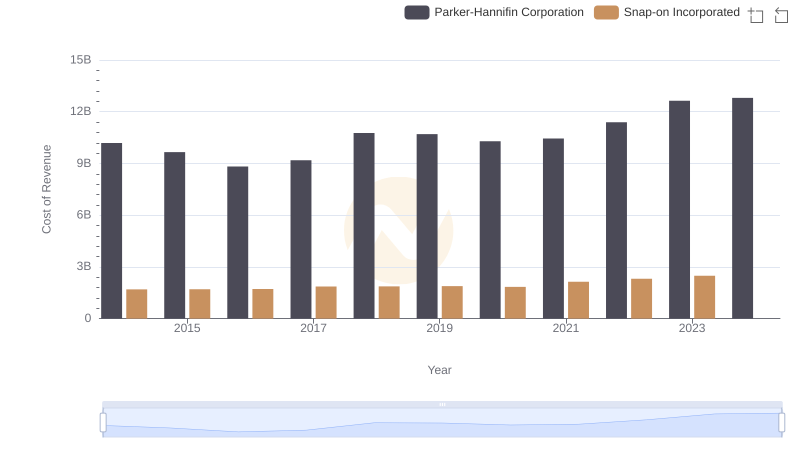
Analyzing Cost of Revenue: Parker-Hannifin Corporation and Snap-on Incorporated
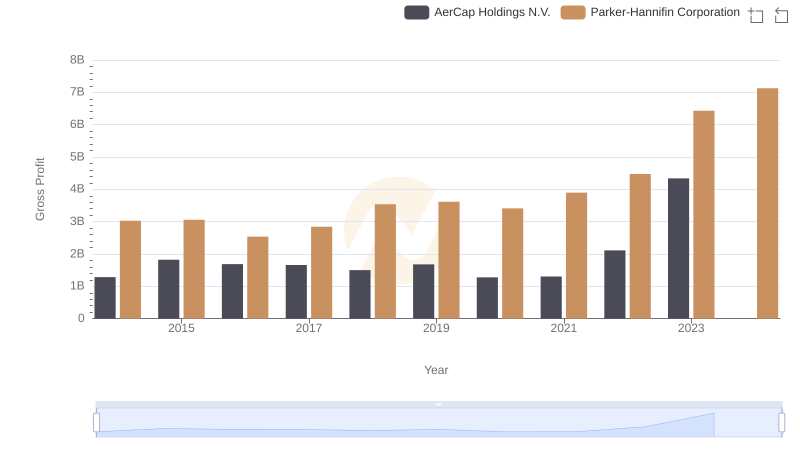
Gross Profit Trends Compared: Parker-Hannifin Corporation vs AerCap Holdings N.V.

Cost of Revenue Trends: Parker-Hannifin Corporation vs Stanley Black & Decker, Inc.
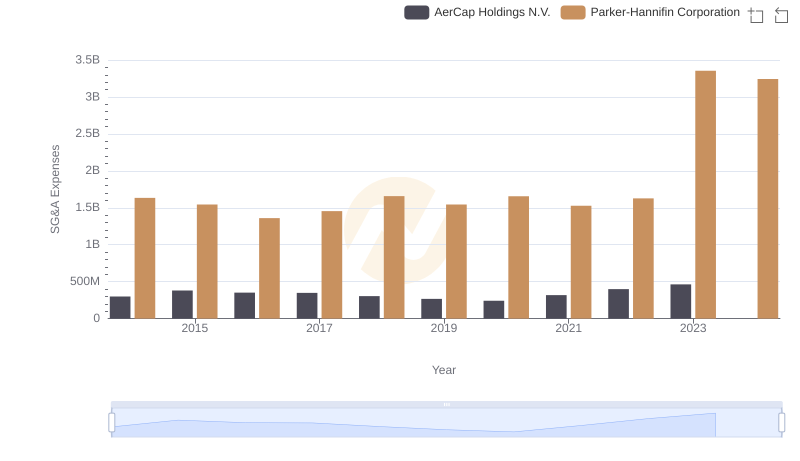
Who Optimizes SG&A Costs Better? Parker-Hannifin Corporation or AerCap Holdings N.V.
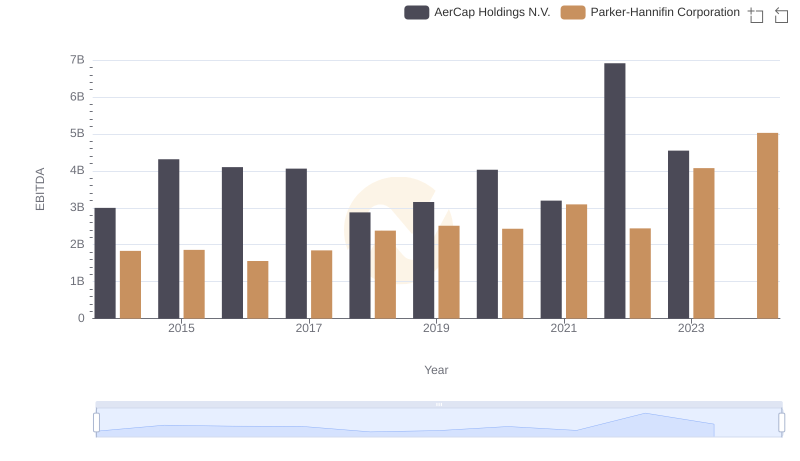
Parker-Hannifin Corporation and AerCap Holdings N.V.: A Detailed Examination of EBITDA Performance